机器学习集群效率:使用 ML 生产力吞吐量分析与优化大规模 Google TPU 系统
发布于 • 作者: Arissa Wongpanich et al.
Machine learning (ML) infrastructures operating at warehouse scale present unique performance characterization challenges beyond traditional high-performance computing metrics. This paper introduces a systematic framework for analyzing ML fleet efficiency, demonstrated on Google’s production TPU infrastructure comprising thousands of accelerators running diverse workloads. Our fleet-wide analysis reveals performance dependencies spanning the entire ML system stack, from hardware to model architecture, data pipelines, frameworks, compilers, and schedulers. We identify critical gaps in conventional utilization-based performance metrics and propose ”ML Productivity Goodput” (MPG) to capture fleet-wide efficiency across heterogeneous ML environments. Using MPG, we provide different methods for identifying and addressing bottlenecks throughout the ML system stack. When applied to Google’s TPU workloads that are used in production, our results show that the methodology yields substantial performance improvements, and establishes a basis for efficient management of large-scale ML computing infrastructure. 在仓库规模的机器学习(ML)基础设施中,性能特征化面临着传统高性能计算指标之外的独特挑战。本文介绍了一种分析机器学习舰队效率的系统框架,该框架在由数千个加速器运行多样化工作负载的谷歌生产 TPU 基础设施上进行了演示。我们的舰队级分析揭示了从硬件到模型架构、数据管道、框架、编译器和调度器的整个 ML 系统栈中的性能依赖关系。我们识别了传统基于利用率性能指标中的关键差距,并提出了“机器学习生产力吞吐量”(ML Productivity Goodput,简称 MPG)来捕捉异构 ML 环境中的舰队级效率。使用 MPG,我们提供了不同的方法来识别和解决 ML 系统栈中的瓶颈。当应用于生产中使用的谷歌 TPU 工作负载时,我们的结果表明该方法论带来了显著的性能提升,并建立了对大规模 ML 计算基础设施进行高效管理的基础。
Table 1.Comparison of Machine Learning (ML) Fleet, Warehouse Scale Computer (WSC), and High-performance Computing (HPC). 表 1. 机器学习(ML)机群、仓储规模计算机(WSC)和高性能计算(HPC)的比较
| Category 分类 | Warehouse Scale Computer 仓库级计算机 | High-Performance Computing 高性能计算 | Machine Learning Fleet 机器学习集群 |
|---|---|---|---|
| Workload types 工作负载类型 | Diverse web services (search, email, social networking, media streaming) 多样化的网络服务(搜索、电子邮件、社交网络、媒体流) |
Scientific simulations, graph computations, solvers 科学模拟、图计算、求解器 |
Training of ML models, real-time serving, bulk inference 机器学习模型的训练、实时服务、批量推理 |
| Fleet composition 舰队组成 | More stable, as most user demand has reached a steady state or known patterns 更加稳定,因为大多数用户需求已达到稳定状态或已知模式 |
A large portion of demand is predetermined, as it is driven by scientific missions 大部分需求是预先确定的,因为它是由科学任务驱动的 |
Rapidly changing due to newly emerging ML models and increasing user demand 由于新出现的 ML 模型和用户需求的增加而快速变化 |
| Hardware heterogeneity 硬件异构性 | General-purpose CPUs 通用 CPU |
CPUs, GPUs, other ASICs CPU、GPU、其他 ASIC |
CPUs, GPUs, TPUs, FPGAs, other ASICs CPU、GPU、TPU、FPGA、其他 ASIC |
| Hardware/Software co-design 硬件/软件协同设计 | Hardware is workload-agnostic 硬件与工作负载无关 |
Hardware is chosen for specialized applications 硬件是为特定应用而选择的 |
ASICs often co-designed with workloads in mind ASIC 通常与工作负载共同设计 |
As machine learning (ML) models become larger and more complex, production fleets must deploy highly parallel training (Vaswani et al., 2017) and low-latency inference (Pope et al., 2023) applications at unprecedented scale. Much like how the boom of internet-scale services (Hamilton, 2007) prompted the development of the warehouse-scale computer (WSC), (Barroso and Hölzle, 2009; Kanev et al., 2015), the current explosion of foundation ML models (Team, 2024; Brown et al., 2020; AI, 2024) is ushering in the era of the ML fleet. ML fleets, sometimes referred to as “AI hypercomputers” (Vahdat and Lohmeyer, 2023), represent a new paradigm in computer architecture, where domain-specific accelerators (DSAs) work in tandem with a modular ML system stack to achieve significant performance and energy efficiency improvements. They are characterized by their massive scale and ML-centric workloads, often requiring more compute power, more storage, and more complex networking than traditional WSCs. Despite the rapid development of these ML fleets, the challenges associated with building and operating them at scale remain significant and poorly understood in the literature. 随着机器学习(ML)模型变得越来越大和越来越复杂,生产集群必须以前所未有的规模部署高度并行训练(Vaswani 等人,2017)和低延迟推理(Pope 等人,2023)应用。正如互联网规模服务(Hamilton,2007)的兴起推动了仓库级计算机(WSC)的开发(Barroso 和 Hölzle,2009;Kanev 等人,2015),当前基础 ML 模型(Team,2024;Brown 等人,2020;AI,2024)的爆炸式增长正开启 ML 集群的时代。ML 集群有时被称为“AI 超级计算机”(Vahdat 和 Lohmeyer,2023),代表了一种新的计算机架构范式,其中特定领域的加速器(DSAs)与模块化的 ML 系统堆栈协同工作,以实现显著的性能和能效提升。它们的特点是规模庞大且以 ML 为中心的工作负载,通常需要比传统 WSC 更多的计算能力、存储空间和更复杂的网络。尽管这些 ML 集群发展迅速,但关于在规模化下构建和运营它们的挑战在文献中仍然重大且未被充分理解。
Figure 1.Five-year historical ML fleet breakdown by accelerator type. The rapid proliferation of domain-specific accelerators in response to ML-based workloads has presented novel challenges in optimizing ML fleets. Managing these domain-specific accelerators means effectively handling hardware and workload heterogeneity, as well as hardware-software co-design at scale. 图 1. 五年历史 ML 集群按加速器类型分解。针对基于 ML 的工作负载,特定领域加速器的快速普及给优化 ML 集群带来了新的挑战。管理这些特定领域加速器意味着有效处理硬件和工作负载异构性,以及大规模的软硬件协同设计。
The contributions of this paper are listed as follows. 本文的贡献如下。
First, we provide a methodology to dissect the ML fleet by segmenting it along the layers of a system stack, from the low-level hardware layer to the user-facing application layer. This analysis reveals three major challenges for ML fleet optimization: hardware heterogeneity, workload heterogeneity, and hardware/software co-design. Traditional optimization strategies, which often rely on stable hardware and workload characteristics, are inadequate for addressing these dynamic interactions. Architecture-centric metrics, such as TOPs/Watt or peak FLOPS, while valuable for specific hardware evaluations, fall short in capturing the overall complexity and efficiency of an ML fleet.
首先,我们提供了一种通过系统堆栈的各个层级对 ML 舰队进行分解的方法,从低级硬件层到面向用户的应用层。这种分析揭示了 ML 舰队优化面临的三个主要挑战:硬件异构性、工作负载异构性以及软硬件协同设计。传统的优化策略通常依赖于稳定的硬件和工作负载特性,无法解决这些动态交互。以架构为中心的指标,如 TOPs/Watt 或峰值 FLOPS,虽然对于特定硬件评估很有价值,但在捕捉 ML 舰队的整体复杂性和效率方面存在不足。
Our second contribution addresses these issues. To view the fleet holistically and capture its performance across multiple layers of the ML system stack, we introduce the “ML Productivity Goodput” (MPG) metric. Unlike traditional metrics, MPG encompasses scheduling efficiency, runtime efficiency, and compiler / program efficiency. MPG is analogous to the “iron law” of computer performance (Eeckhout, 2010), but adapted for ML fleets as shown in Figure 2. The MPG metric enables us to identify areas for improvement across the entire machine learning fleet by analyzing performance across different segments, such as accelerator type, model architecture, and workload phase (e.g., training vs. serving). By breaking down the metric into subcomponents—Scheduling Goodput (SG), Runtime Goodput (RG), and Program Goodput (PG)—and examining it along the axes of fleet characteristics, we can precisely pinpoint optimization opportunities.
我们的第二个贡献解决了这些问题。为了全面地查看机队并捕捉其在 ML 系统堆栈多个层面的性能,我们引入了“ML 生产力吞吐量”(MPG)指标。与传统指标不同,MPG 涵盖了调度效率、运行时效率和编译器/程序效率。MPG 类似于计算机性能的“铁律”(Eeckhout,2010),但针对 ML 机队进行了调整,如图 2 所示。MPG 指标使我们能够通过分析不同片段(如加速器类型、模型架构和工作负载阶段(例如训练与服务))的性能,识别整个机器学习机队中的改进领域。通过将指标分解为子组件——调度吞吐量(SG)、运行时吞吐量(RG)和程序吞吐量(PG)——并沿着机队特征的轴进行分析,我们可以精确地定位优化机会。
Finally, we provide a procedure for leveraging the MPG metric and show strategies that we deployed in the real world for optimizing ML fleet performance with the help of this metric. We show how MPG helps us identify compiler optimizations to generate more efficient code for specific hardware configurations, and improve scheduling algorithms to better utilize heterogeneous resources within the fleet, along with a few other strategies. Even after optimizations are implemented in the fleet, the MPG metric can be used to validate and track fleet-wide improvements.
最后,我们提供了一种利用 MPG 指标的方法,并展示了我们在现实世界中为借助该指标优化 ML 集群性能所部署的策略。我们展示了 MPG 如何帮助我们识别编译器优化,以生成针对特定硬件配置的更高效代码,以及改进调度算法以更好地利用集群内的异构资源,以及其他一些策略。即使在集群中实施了优化,MPG 指标仍可用于验证和跟踪全集群的改进。
These contributions collectively provide a basis for understanding and optimizing large-scale ML infrastructure, thereby paving the way for more efficient, sustainable, and cost-effective deployment of ML workloads across diverse computing environments. 这些贡献共同为理解和优化大规模机器学习基础设施奠定了基础,从而为在不同计算环境中更高效、可持续和具有成本效益地部署机器学习工作负载铺平了道路。
We introduce the concept of an ML fleet, a specialized form of computing infrastructure designed specifically for ML workloads at scale. To help set the stage for an ML fleet, we compare ML fleets with two related large-scale computing paradigms: traditional warehouse-scale computers (WSC) (Barroso and Hölzle, 2009) and high-performance computing (HPC) supercomputers (Asanovic et al., 2009). An ML fleet can be considered an evolution of a WSC, adapted for high-performance ML workloads. 我们介绍了 ML 集群的概念,这是一种专门为大规模 ML 工作负载设计的计算基础设施。为了为 ML 集群奠定基础,我们将 ML 集群与两种相关的超大规模计算范式进行了比较:传统的仓库规模计算机(WSC)(Barroso 和 Hölzle,2009)和高性能计算(HPC)超级计算机(Asanovic 等人,2009)。ML 集群可以被视为 WSC 的一种演进,专为高性能 ML 工作负载进行了适配。
Table 1 summarizes the key features of each system type, highlighting their distinct characteristics. We examine these features to better understand how the unique demands of ML workloads have shaped the design and optimization strategies of ML fleets, setting them apart from their predecessors in large-scale computing. 表 1 总结了每种系统类型的关键特征,突出了它们的独特性。我们研究这些特征,以更好地理解 ML 工作负载的独特需求如何塑造了 ML 机队的设计和优化策略,使它们区别于大规模计算的前代系统。
WSCs (Barroso and Hölzle, 2009) traditionally focus on Internet-scale services, which serve web content, process user queries, and handle data storage and retrieval for billions of users. WSCs must manage diverse, often latency-sensitive tasks such as search indexing (Brin and Page, 1998), social media feeds (Nishtala et al., 2013), and transaction processing services. The workloads are characterized by their burstiness and high concurrency, with millions of small, independent tasks that require fast response times. 大型数据中心(Barroso 和 Hölzle,2009)传统上专注于互联网规模的服务,这些服务提供网页内容、处理用户查询,并为数十亿用户提供数据存储和检索服务。大型数据中心必须管理多样化、通常对延迟敏感的任务,如搜索索引(Brin 和 Page,1998)、社交媒体动态(Nishtala 等人,2013)和事务处理服务。这些工作负载的特点是突发性和高并发,涉及数百万个需要快速响应时间的独立小任务。
High-performance computing, on the other hand, has focused on simulation models for research, such as climate modeling (Menemenlis et al., 2005), and molecular dynamics for drug discovery (Schulz et al., 2009). These workloads involve complex, tightly-coupled computations that require both significant processing power and high-bandwidth, low-latency communication between nodes (Stegailov et al., 2019). They operate on large datasets and require sustained performance over long periods of execution. 高性能计算则专注于研究领域的模拟模型,例如气候模拟(Menemenlis 等人,2005 年),以及用于药物发现的分子动力学(Schulz 等人,2009 年)。这些工作负载涉及复杂、紧密耦合的计算,需要大量的处理能力和节点间的高带宽、低延迟通信(Stegailov 等人,2019 年)。它们处理大型数据集,并在长时间运行中需要持续的性能。
ML fleets combine the scale of WSC workloads with the computational intensity of HPC workloads. They consist of workloads which are focused on running deep neural networks (Krizhevsky et al., 2012), such as recommendation models (Naumov et al., 2019; Zhao et al., 2022) for e-commerce and social media, computer vision tasks for autonomous vehicles (Janai et al., 2020) and medical imaging (Esteva et al., 2021), and natural language processing (NLP) applications like large language models for chatbots and translation services (Zhao et al., 2021). ML workloads involve heavy matrix-matrix (Fatahalian et al., 2004) or matrix-vector (Bell and Garland, 2008) operations and parallel processing that often require high computational throughput and memory bandwidth. ML workloads also tend to be more communication-bound rather than compute-bound (Li et al., 2014), especially since large models are often sharded across many chips and require large datasets to be fed as input. ML fleets also face another key challenge, which is rapidly fluctuating user demand and huge tectonic shifts in ML model architectures, as discussed in Section 1. As a result, the designers of an ML fleet need to trade off specialization with fungibility to adapt quickly while still delivering peak performance. ML 集群结合了 WSC 工作负载的规模和 HPC 工作负载的计算强度。它们由专注于运行深度神经网络(Krizhevsky 等人,2012 年)的工作负载组成,例如用于电子商务和社交媒体的推荐模型(Naumov 等人,2019 年;Zhao 等人,2022 年)、自动驾驶汽车的计算机视觉任务(Janai 等人,2020 年)和医学影像(Esteva 等人,2021 年),以及自然语言处理(NLP)应用,如用于聊天机器人和翻译服务的大型语言模型(Zhao 等人,2021 年)。ML 工作负载涉及大量的矩阵-矩阵(Fatahalian 等人,2004 年)或矩阵-向量(Bell 和 Garland,2008 年)运算和并行处理,通常需要高计算吞吐量和内存带宽。ML 工作负载往往更受通信限制而非计算限制(Li 等人,2014 年),特别是由于大型模型通常跨多个芯片分片,并且需要大量数据集作为输入。ML 集群还面临另一个关键挑战,即快速波动的用户需求和 ML 模型架构的巨大变革,如第 1 节所述。 因此,ML 集群的设计师需要在专业化和可替代性之间进行权衡,以便快速适应同时仍能提供最佳性能。
The hardware composition of these systems also reflects the demands of its users. WSCs usually rely on general-purpose commodity CPUs (Barroso and Hölzle, 2009), balancing diverse computational needs for web services, and scaling massively to accommodate varying user demands (Ranganathan and Holzle, 2024). HPC supercomputers, designed for complex scientific calculations, utilize specialized vector processors (Odajima et al., 2020) and accelerators to achieve extreme performance for tightly-coupled computations. An ML fleet must utilize hardware that can provide both the scalability of a WSC and the performance intensity of a HPC supercomputer. They are mostly comprised of accelerators such as GPUs, TPUs, and/or other ML application-specific integrated circuits (ASICs) that are optimized for the compute-intensive parallel processing demands of machine learning tasks. They also make significant use of general-purpose chips like CPUs for hosting or scheduling tasks. 这些系统的硬件组成也反映了其用户的需求。Web 服务集群(WSCs)通常依赖通用商用 CPU(Barroso 和 Hölzle,2009),平衡多样化的计算需求,并大规模扩展以适应不同的用户需求(Ranganathan 和 Holzle,2024)。高性能计算(HPC)超级计算机为复杂科学计算而设计,利用专用向量处理器(Odajima 等人,2020)和加速器,以实现紧密耦合计算的超强性能。一个机器学习(ML)集群必须使用能够同时提供 Web 服务集群的可扩展性和高性能计算超级计算机的性能强度的硬件。它们主要由针对机器学习任务计算密集型并行处理需求进行优化的加速器组成,如 GPU、TPU 和/或其他专用集成电路(ASICs)。它们也大量使用通用芯片如 CPU 来托管或调度任务。
Memory and storage architectures are also highly tailored to their specific workloads’ needs. ML fleets typically employ high-throughput, local memory systems coupled with ML-optimized SSD storage, which facilitates fast data access and parallelism for iterative learning algorithms(Kumar et al., 2021). WSCs, on the other hand, utilize distributed, commodity-based memory and storage systems, prioritizing cost-effectiveness and redundancy for handling diverse, large-scale web services (Barroso and Hölzle, 2009). HPC supercomputers feature low-latency, parallel-optimized memory architectures and parallel file systems, enabling efficient processing of massive scientific datasets. These distinctions in memory and storage design influence each system’s data handling capabilities: WSCs ensure robust, scalable data management for varied web applications; HPC systems focus on minimizing latency for complex, data-intensive scientific computations; and ML fleets optimize for repeated, high-throughput access to training data and weight updates. 内存和存储架构也高度定制化以适应其特定工作负载的需求。机器学习集群通常采用高吞吐量的本地内存系统,并搭配机器学习优化的 SSD 存储,这有助于迭代学习算法快速访问数据和实现并行性(Kumar 等人,2021)。另一方面,Web 服务集群则利用分布式、基于商用标准的内存和存储系统,优先考虑成本效益和冗余性,以处理多样化的大规模 Web 服务(Barroso 和 Hölzle,2009)。高性能计算超级计算机则配备低延迟、并行优化的内存架构和并行文件系统,能够高效处理庞大的科学数据集。这些内存和存储设计的差异影响了每个系统的数据处理能力:Web 服务集群确保为各种 Web 应用提供稳健、可扩展的数据管理;高性能计算系统专注于最小化复杂、数据密集型科学计算的延迟;而机器学习集群则针对训练数据的重复、高吞吐量访问和权重更新进行优化。
Network infrastructure and job scheduling in ML fleets, WSCs, and HPC supercomputers are also optimized for their respective workloads. WSCs employ distribution-optimized networks to handle diverse, geographically dispersed web traffic, using cloud-based or custom schedulers (Burns et al., 2016) designed for varied, often short-lived tasks. HPC supercomputers, however, feature ultra-low latency networks crucial for tightly-coupled parallel computations, alongside specialized job schedulers like SLURM(Yoo et al., 2003) that manage complex, long-running scientific workloads. ML fleets prioritize high-bandwidth networks (Zu et al., 2024) to facilitate rapid data movement for distributed training, coupled with job schedulers like Borg (Verma et al., 2015), Kubernetes (Rensin, 2015) and MAST(Choudhury et al., 2024) that efficiently manage GPU/TPU resources. These differences in network and scheduling approaches directly impact each system’s ability to handle its target applications. ML 集群、WSCs 和 HPC 超级计算机的网络基础设施和作业调度也针对各自的工作负载进行了优化。WSCs 采用分布式优化网络来处理多样且地理上分散的网页流量,使用基于云或定制的调度器(Burns 等人,2016 年)来处理多变且通常生命周期较短的作业。然而,HPC 超级计算机配备了超低延迟网络,这对紧密耦合的并行计算至关重要,同时配有专门的任务调度器,如 SLURM(Yoo 等人,2003 年),用于管理复杂的、长时间运行的科学工作负载。ML 集群优先考虑高带宽网络(Zu 等人,2024 年),以促进分布式训练中的快速数据传输,并配有 Borg(Verma 等人,2015 年)、Kubernetes(Rensin,2015 年)和 MAST(Choudhury 等人,2024 年)等作业调度器,这些调度器能高效管理 GPU/TPU 资源。这些网络和调度方法上的差异直接影响每个系统处理其目标应用的能力。
Efficiency considerations and workloads vary across ML fleets, WSCs, and HPC supercomputers. ML fleets exhibit workload dependent energy efficiency, with high initial costs due to model training, but improved efficiency with tasks like bulk inference. WSCs prioritize high energy efficiency at scale and low per-unit costs, despite high aggregate expenses, handling diverse web services (Corbett et al., 2012) and cloud computing workloads. Meanwhile, HPC supercomputers focus on maximum performance for tightly-coupled scientific simulations, often at the expense of energy efficiency(Kamil et al., 2008). 效率考量和工作负载在不同机器学习集群、Web 服务集群和高性能计算超级计算机之间存在差异。机器学习集群表现出与工作负载相关的能效,由于模型训练导致初始成本较高,但在批量推理等任务上效率有所提升。Web 服务集群优先考虑大规模下的高能效和低单位成本,尽管总体支出较高,但处理多样化的网络服务(Corbett 等人,2012)和云计算工作负载。与此同时,高性能计算超级计算机专注于为紧密耦合的科学模拟提供最大性能,往往以牺牲能效为代价(Kamil 等人,2008)。
These distinctions in efficiency and workload optimization reflect each system’s primary purpose: ML fleets are designed for flexible, scalable AI computation; WSCs for cost-effective, large-scale web services; and HPC systems for pushing the boundaries of computational performance in scientific research. The trade-offs between cost, energy efficiency, and performance in each system are carefully balanced to best serve their intended applications. In particular, if we wish to measure the performance of the ML fleet and identify opportunities for further optimization, we must study its characteristics across all levels of the system stack. 这些效率和工作负载优化的区别反映了每个系统的主要用途:ML 舰队旨在进行灵活、可扩展的 AI 计算;WSC(Web Service Centers)旨在提供具有成本效益的大规模网络服务;而 HPC(High-Performance Computing)系统则用于推动科学研究中的计算性能边界。每个系统在成本、能源效率和性能之间的权衡都经过精心平衡,以最好地服务于其预期应用。特别是,如果我们希望测量 ML 舰队的性能并找出进一步优化的机会,我们必须研究它在系统堆栈所有层面的特征。
Figure 3.The ML fleet system stack of a production system at Google. The multi-layered architecture of a fleet is complex; each layer is a critical component in the ML system, with interactions between layers affecting overall performance and efficiency. Segmenting the fleet based on these layers provides actionable metrics which can be used to improve performance. 图 3. Google 生产系统中 ML 舰队系统堆栈。舰队的多层架构复杂;每一层都是 ML 系统中的关键组件,层与层之间的交互影响整体性能和效率。基于这些层对舰队进行分段可以提供可操作的指标,用于提升性能。
We begin by dissecting Google’s user-facing production ML fleet, analyzing its components from hardware foundation to application level. Figure 3 shows the layers comprising the system stack that mediate user access. We supplement our discussion with data from a snapshot of Google’s TPU fleet for internal workloads, providing concrete examples of challenges these systems face. 我们首先剖析 Google 面向用户的生产行业舰队,从硬件基础到应用层分析其组件。图 3 展示了介导用户访问的系统堆栈层。我们结合 Google 内部工作负载的 TPU 舰队快照数据,补充讨论内容,提供这些系统面临的挑战的具体实例。
ML fleets are distinguished from other types of large-scale systems by their accelerator-centric architecture. The ML computing landscape is dominated by domain-specific hardware, such as GPUs and other ASICs. In order to tailor to the vector and matrix intensive operations that underpin ML workloads, there has been a Cambrian explosion of ML hardware accelerators (Hennessy and Patterson, 2019), with new accelerators being deployed at an unprecedented rate compared to traditional WSC fleets (Jouppi et al., 2021). Figure 1 illustrates this dynamism, showing dramatic shifts in our ML fleet’s hardware makeup for internal workloads over just a few years. 机器学习集群与其他大型系统不同,其架构以加速器为中心。机器学习计算领域由特定领域的硬件主导,如 GPU 和其他 ASIC。为了适应支撑机器学习工作负载的向量和矩阵密集型操作,机器学习硬件加速器经历了寒武纪大爆发(Hennessy 和 Patterson,2019),其部署速度远超传统 WSC 集群(Jouppi 等,2021)。图 1 展示了这种动态性,显示了仅几年内我们机器学习集群的硬件构成对内部工作负载的剧烈变化。
ML fleets typically incorporate a diverse array of hardware including CPUs, GPUs, TPUs, and other accelerators, each fulfilling specific roles. For example, CPUs may be responsible for scheduling, GPUs for training tasks, and edge accelerators (Yazdanbakhsh et al., 2021) for deployment and serving. The challenge lies in effectively orchestrating these heterogeneous accelerators to maximize their individual strengths—a complexity rarely encountered in general compute fleets. 机器学习集群通常包含多种硬件,包括 CPU、GPU、TPU 和其他加速器,每个都承担特定角色。例如,CPU 可能负责调度,GPU 用于训练任务,边缘加速器(Yazdanbakhsh 等,2021)用于部署和服务。挑战在于有效协调这些异构加速器以最大化其各自优势——这种复杂性在通用计算集群中很少遇到。
Moreover, the heterogeneity extends beyond just accelerator type. Even within a single class of hardware accelerators, there are many different versions of the hardware, adding another layer of complexity to fleet management. Each hardware generation introduces unique features that require significant optimizations to extract peak ML workload efficiency. One notable example is the integration of the SparseCore (SC) in TPUv4 (Jouppi et al., 2023), which was designed to significantly boost performance for embedding-heavy models. Subsequent large-embedding model teams would likely then consider the hardware specifications of the SparseCore when designing their embedding configurations. Model design configurations such as embedding dimension, vocabulary size, valence, and others might also be co-designed to optimize performance on the hardware platform. This shows how hardware-software co-design is becoming increasingly important in improving the efficiency of these diverse accelerators, forming a symbiotic relationship where the computational needs of future workloads affect the next generation of hardware, and the hardware capabilities inform the types of workloads that the ML fleet is best equipped to handle (Shi et al., 2020). 此外,异构性并不仅仅局限于加速器类型。即使在同一类硬件加速器中,也存在许多不同的硬件版本,为集群管理增加了另一层复杂性。每一代硬件都会引入独特的功能,需要显著的优化才能提取出峰值 ML 工作负载效率。一个值得注意的例子是 TPUv4(Jouppi 等人,2023 年)中集成的 SparseCore(SC),它被设计用来显著提升嵌入密集型模型的性能。随后的大嵌入模型团队可能会在设计其嵌入配置时考虑 SparseCore 的硬件规格。嵌入维度、词汇表大小、价态以及其他模型设计配置也可能协同设计,以优化在硬件平台上的性能。 这展示了硬件-软件协同设计在提高这些多样化加速器效率方面的重要性日益凸显,形成了一种共生关系:未来工作负载的计算需求影响着下一代硬件,而硬件能力则决定了 ML 舰队最适合处理的工作负载类型(Shi 等人,2020)。
Figure 4.A sample breakdown of Google’s ML fleet for internal workloads, segmenting on workload topology size (the number of accelerators requested by a given job). Progressive snapshots over the course of one year illustrate the ML fleet’s growing share of jobs using an ”extra-large” number of accelerators. This demonstrates how an ML fleet scheduler must be able to adapt to changing conditions, as the evolution of job sizes and topologies in response to shifting ML workloads presents unique challenges for the entire fleet. 图 4. Google 内部工作负载的 ML 舰队样本分解,按工作负载拓扑大小(特定任务请求的加速器数量)进行分段。一年期间逐步的快照显示了使用“超大型”数量加速器的任务在 ML 舰队中所占份额的增长。这表明 ML 舰队调度器必须能够适应不断变化的环境,因为随着 ML 工作负载的变化,任务大小和拓扑结构的演变对整个舰队提出了独特的挑战。
The scheduler directly manages the hardware in a fleet by coordinating the allocation of resources. For the case study presented in this paper, it coordinates TPU allocations for Google’s internal-facing ML workloads. There are two interconnected challenges that a scheduler must address when allocating hardware for an ML fleet: (1) optimizing performance across various hardware types, and (2) balancing utilization with stability and fault tolerance. 调度器通过协调资源分配来直接管理集群中的硬件。对于本文所展示的案例研究,它协调分配谷歌内部面向的机器学习工作负载的 TPU 资源。当调度器为机器学习集群分配硬件时,必须解决两个相互关联的挑战:(1)优化不同硬件类型的性能,以及(2)平衡利用率与稳定性和容错能力。
Figure 4 illustrates these challenges. It shows the allocation of workloads in Google’s internal-facing ML fleet with different chip requirements over time, categorized into sizes based on the total number of TPU chips in the required topology. In this categorization, workloads with size ”small” refer to jobs that request a single TPU or a handful of TPUs, while workloads with size ”extra-large” refer to jobs that request the largest number of TPUs (often requiring multiple pods, as described in Kumar et al. (2021)). Figure 4 demonstrates that over the course of just one year, the allocation distribution can shift dramatically, reflecting the changing nature of ML workloads in the fleet. As large-scale ML models become more prevalent in an ML fleet, an increasing number of workloads will require correspondingly larger meshes of connected accelerators. 图 4 说明了这些挑战。它展示了谷歌内部 ML 舰队中不同芯片需求的工作负载分配随时间的变化,并根据所需拓扑中 TPU 芯片的总数将工作负载分为不同大小。在此分类中,大小为“小”的工作负载指的是请求单个 TPU 或少量 TPU 的任务,而大小为“超大型”的工作负载指的是请求最多 TPU 的任务(通常需要多个 Pod,如 Kumar 等人(2021)所述)。图 4 表明,在短短一年内,分配分布可能发生巨大变化,反映了舰队中 ML 工作负载的性质变化。随着大规模 ML 模型在 ML 舰队中变得更加普遍,越来越多的工作负载将需要相应更大规模的连接加速器网络。
Optimizing the scheduling of jobs while meeting these resource requirements is difficult because it presents an NP-hard bin-packing problem. Each workload may specify a different accelerator type, chip topology, and location requirement and needs to be scheduled according to fleet constraints in a way that reduces overall fragmentation of the fleet. Since workloads are constantly being started and completed, the machine availability of the fleet is constantly changing, requiring a robust defragmentation algorithm. In addition, latency requirements may require accelerators for a workload to be grouped together near certain locations or data cells, adding another constraint to the scheduling optimization problem. 在满足这些资源需求的同时优化作业调度是困难的,因为它呈现为一个 NP-hard 的装箱问题。每个工作负载可能指定不同的加速器类型、芯片拓扑和位置要求,并且需要根据舰队约束进行调度,以减少整个舰队的碎片化。由于工作负载不断启动和完成,舰队的机器可用性不断变化,需要一种强大的去碎片化算法。此外,延迟要求可能需要将工作负载的加速器分组放置在特定位置或数据单元附近,给调度优化问题增加了另一个约束。
The utilization of fleet resources must also be balanced with stability and fault tolerance. For example, to reduce disruptions, some machines may intentionally remain underutilized so that higher priority jobs may be more easily scheduled when needed. While high utilization is desirable for cost-efficiency, pushing hardware to its limits can lead to thermal issues, increased failure rates, and unpredictable performance. In large-scale ML fleets, hardware failures are inevitable, and the scheduler must be robust enough to handle these failures gracefully, redistributing workloads and ensuring job continuity without significant performance degradation. 对集群资源的使用也必须与稳定性和容错性相平衡。例如,为了减少中断,一些机器可能会有意保持低利用率,以便在需要时更容易调度高优先级任务。虽然高利用率对成本效益是有益的,但将硬件推向极限可能导致热问题、故障率增加和性能不可预测。在大规模的机器学习集群中,硬件故障是不可避免的,调度器必须足够健壮,能够优雅地处理这些故障,重新分配工作负载并确保任务连续性,同时不会导致性能显著下降。
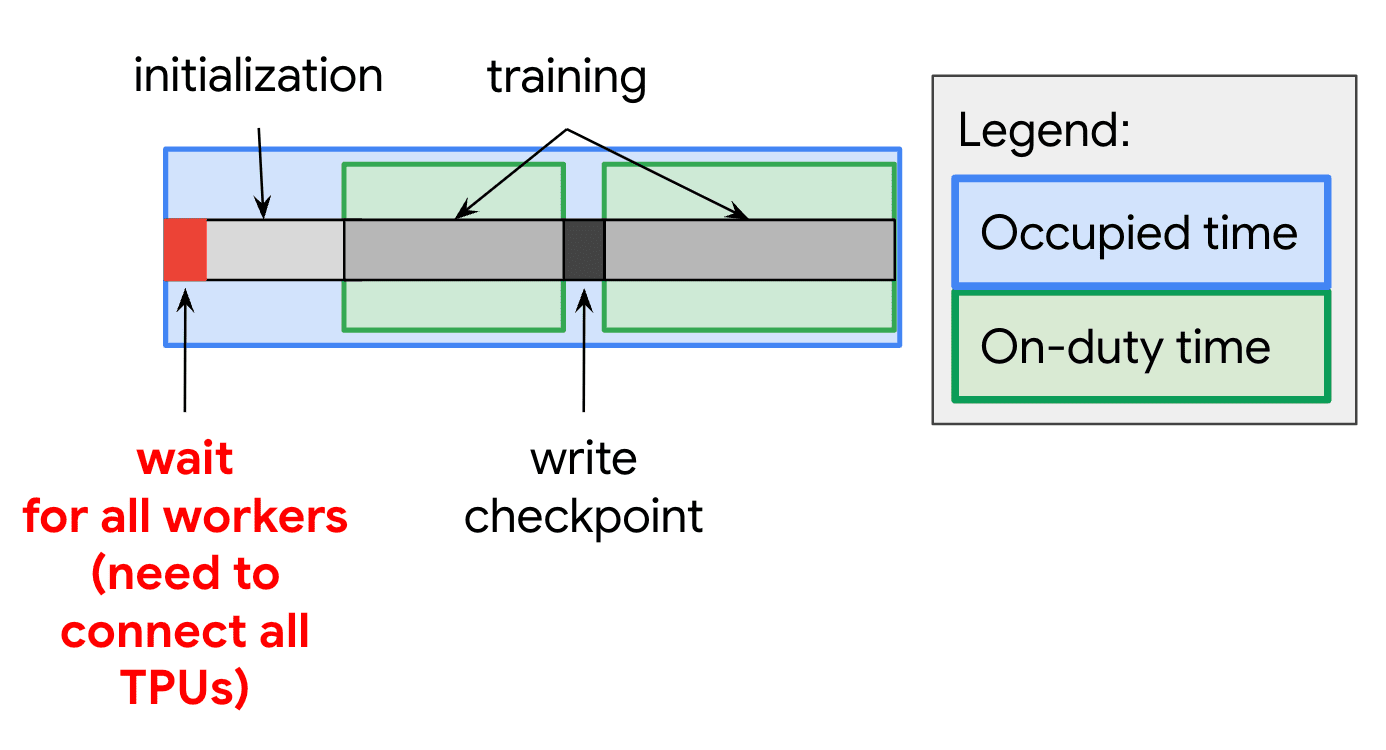
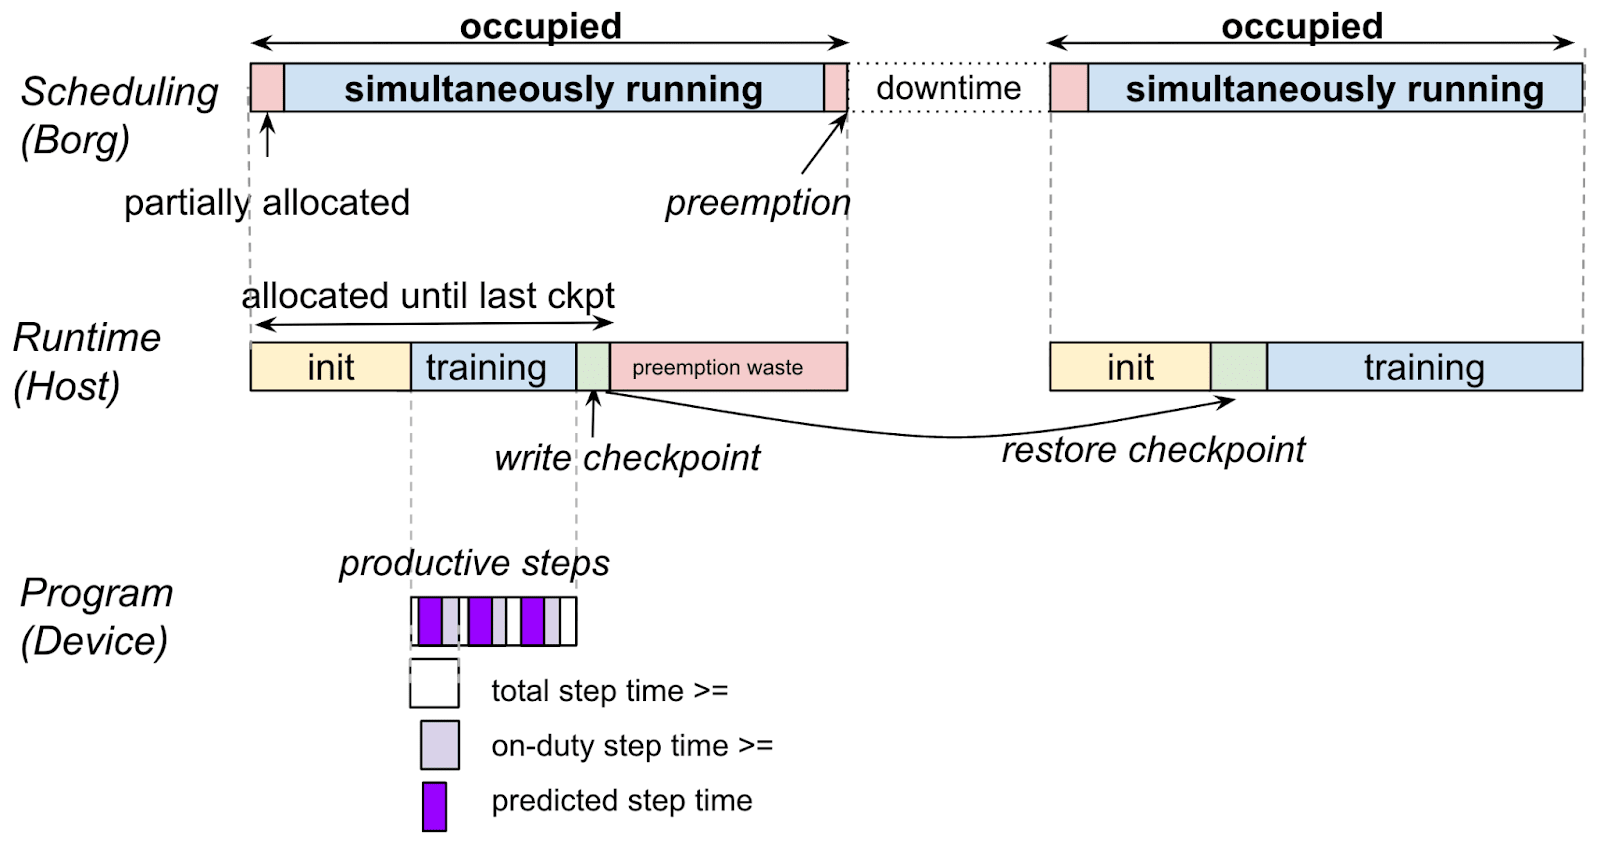
Figure 5.An ML workload requires all requested TPUs to be allocated before the task can start. In this example of a training workload, forward progress is saved via checkpoints. Delays during workload initialization and checkpoint writing, which are part of the Runtime and Framework layers, can reduce overall system efficiency. 图 5. 一个 ML 工作负载需要在任务开始前分配所有请求的 TPU。在这个训练工作负载的示例中,通过检查点保存正向进展。工作负载初始化和检查点写入期间的延迟,这些是运行时和框架层的一部分,会降低整体系统效率。
The runtime and compiler layers form an important component in the ML fleet system stack. They are responsible for bridging the gap between high-level ML models and the underlying hardware accelerators. The runtime layer focuses on the execution environment of ML programs. It handles important tasks such as program setup, data feeding, result management, and checkpoint creation, as illustrated in Figure 5. Depending on the system design, it either triggers just-in-time compilation of user-written code into accelerator-specific instructions or invokes pre-compiled operation kernels from vendor-specific libraries. The runtime layer can also manage the distribution strategy of code execution, as with notable runtimes like Pathways (Barham et al., 2022). 运行时和编译器层是 ML 舰队系统堆栈中的重要组成部分。它们负责在高级 ML 模型和底层硬件加速器之间架起桥梁。运行时层专注于 ML 程序的执行环境。它处理程序设置、数据输入、结果管理和检查点创建等重要任务,如图 5 所示。根据系统设计,它要么触发将用户编写的代码即时编译成特定于加速器的指令,要么从特定于供应商的库中调用预编译的操作内核。运行时层还可以管理代码执行的分布策略,例如 Pathways(Barham 等人,2022 年)等知名运行时。
Figure 6 shows the growth of Pathways-based workloads in our production fleet. It highlights the demand for runtimes that support efficient distributed execution for ML workloads. It also emphasizes the rapidly shifting distribution of workload runtimes in a fleet. 图 6 展示了我们生产集群中基于 Pathways 的工作负载的增长情况。它突出了对支持高效分布式执行的 ML 工作负载运行时的需求。它还强调了集群中工作负载运行时分布的快速变化。
The compiler layer, working with the runtime, transforms high-level ML model code into executable code optimized for specific accelerators. It operates on graph intermediate representations, applying both platform-independent and platform-dependent optimizations. The output is a program tailored to the target accelerator, such as a specific version of a TPU. Domain-specific compilers, like XLA (Accelerated Linear Algebra) (xla, n. d.), have significantly improved the performance of ML workloads. For instance, in MLPerf BERT benchmarks (Mattson et al., 2020), XLA demonstrated a remarkable 7× performance boost and 5× batch size improvement (Kumar et al., 2021) over previous records, emphasizing the potential of specialized compilation techniques. We note that there are many types of accelerators, some of which do not require an explicit compiler for code generation. 编译器层与运行时协同工作,将高级 ML 模型代码转换为针对特定加速器优化的可执行代码。它基于图中间表示进行操作,应用平台无关和平台相关的优化。输出是为目标加速器量身定制的程序,例如特定版本的 TPU。领域专用编译器,如 XLA(加速线性代数)(xla,n. d.),显著提升了 ML 工作负载的性能。例如,在 MLPerf BERT 基准测试(Mattson 等人,2020)中,XLA 相较于之前的记录实现了显著的 7× 性能提升和 5× 批处理大小改进(Kumar 等人,2021),突显了专用编译技术的潜力。我们注意到存在多种类型的加速器,其中一些无需显式编译器进行代码生成。
Compiler optimization in ML fleets faces unique challenges due to the rapid evolution of hardware accelerators, requiring frequent updating of optimization strategies to leverage the specific features of each new hardware generation. Moreover, the impact of optimizations can be difficult to generalize, as an optimization that improves one workload may degrade another due to differences in computation or communication patterns. This emphasizes the need for a balanced approach to optimization, considering both platform-independent techniques for flexibility and platform-specific optimizations for maximum performance. 在 ML 集群中的编译器优化面临着独特的挑战,因为硬件加速器的快速演变需要频繁更新优化策略以利用每一代新硬件的特定功能。此外,优化的影响可能难以推广,因为改进一个工作负载的优化可能会由于计算或通信模式的不同而降低另一个工作负载的性能。这强调了优化需要采取平衡方法,既考虑平台无关技术以实现灵活性,也考虑平台特定优化以获得最大性能。
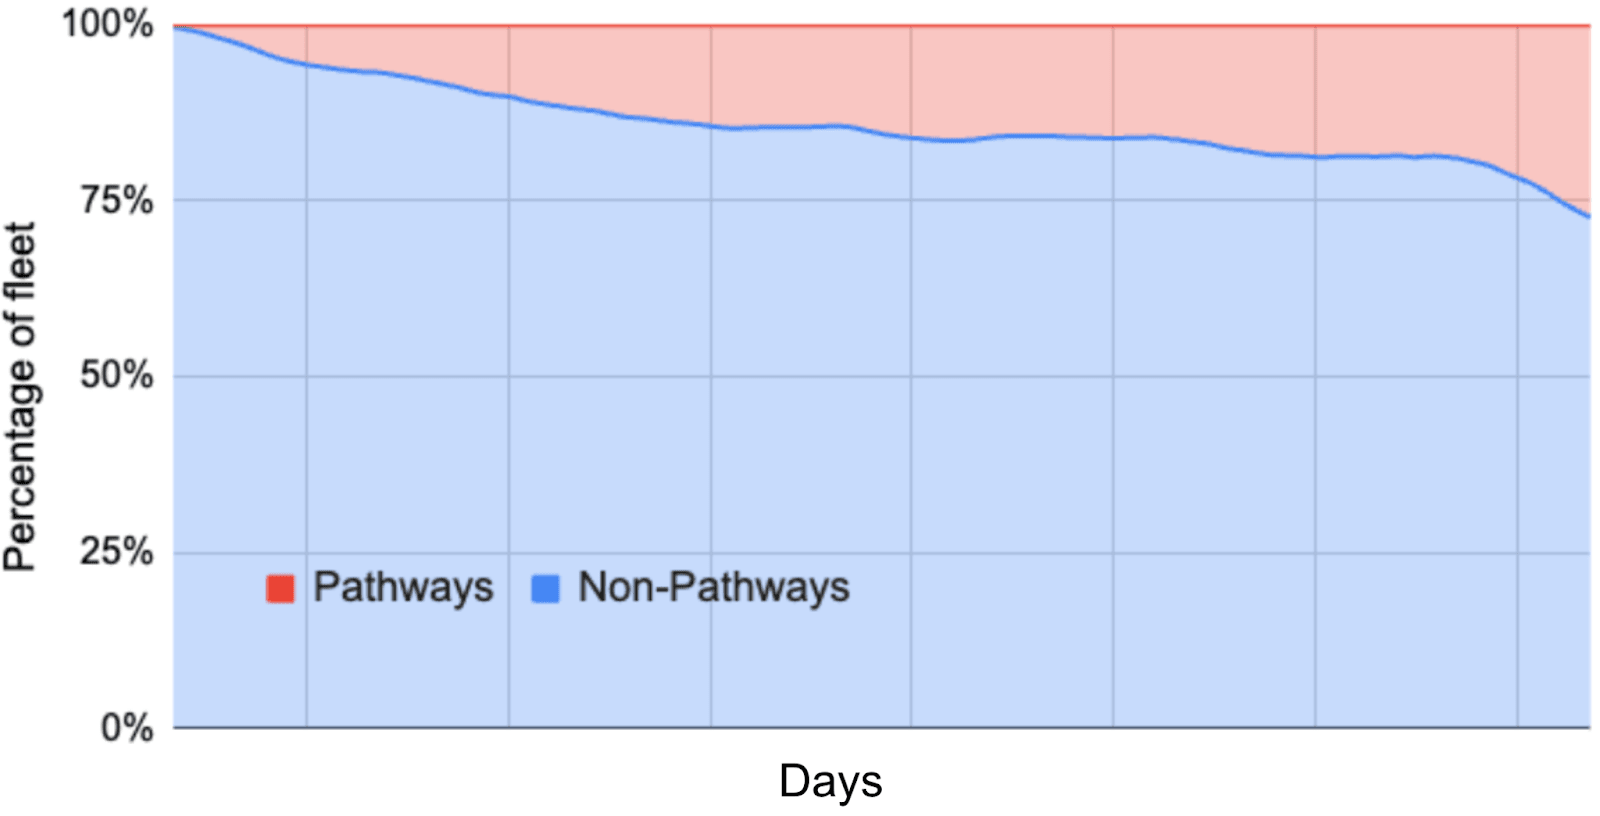
Figure 6.The prevalence of fleet-wide workloads using the Pathways runtime over a sample of one year, illustrating the rapid shift of fleet-wide runtimes to accommodate changing workloads. Pathways adoption has increased rapidly, as it provides better support for distributed execution and data processing. 图 6. 一年内使用 Pathways 运行时的车队级工作负载的普遍性,说明了车队级运行时的快速转变以适应变化的工作负载。Pathways 的采用迅速增加,因为它为分布式执行和数据处理提供了更好的支持。
The framework layer sits on top of the runtime/compiler. It is the interface between ML practitioners and the underlying complex hardware and software infrastructure. This layer encompasses various ML frameworks and libraries, such as TensorFlow (Abadi et al., 2016b), JAX (Frostig et al., 2018), and PyTorch (Paszke et al., 2019), each offering unique features and optimizations. 框架层位于运行时/编译器之上,它是机器学习从业者与底层复杂硬件和软件基础设施之间的接口。这一层涵盖了各种机器学习框架和库,例如 TensorFlow(Abadi 等人,2016b)、JAX(Frostig 等人,2018)和 PyTorch(Paszke 等人,2019),每个框架都提供独特的功能和优化。
The framework layer provides high-level abstractions and APIs that allow developers to build and deploy ML models efficiently. These frameworks are responsible for translating user-written code into representations that can be understood and optimized by lower-level layers such as compilers and runtimes. This translation process bridges the gap between user intent and system execution. 框架层提供高级抽象和 API,使开发者能够高效地构建和部署机器学习模型。这些框架负责将用户编写的代码转换为编译器和运行时等低层可以理解和优化的表示形式。这一转换过程弥合了用户意图与系统执行之间的差距。
One of the key responsibilities of ML frameworks is defining the structure of distributed ML applications. For example, TensorFlow’s Distribution Strategy (Abadi et al., 2016a) provides a framework for distributing training across multiple devices or machines. These can have single-client or multi-client architectures, depending on workload needs, as shown in Figure 7. These frameworks must also map ML primitives to hardware-specific designs to achieve optimal performance. This is important for specialized hardware like TPUs, which are designed for bulk-synchronous training. Frameworks like JAX are more targeted towards ML workloads, with features that facilitate ease of interpretability when analyzing ML performance, such as high-level tracing for just-in-time compilation. In the ML fleet, JAX usage has increased over time, most likely due to these features and the emergence of more ML-heavy workloads (Frostig et al., 2018). ML 框架的一项关键职责是定义分布式 ML 应用的结构。例如,TensorFlow 的分布式策略(Abadi 等人,2016a)提供了一个跨多个设备或机器进行训练的框架。根据工作负载需求,这些架构可以是单客户端或多客户端架构,如图 7 所示。这些框架还必须将 ML 原语映射到特定硬件的设计上,以实现最佳性能。这对于像 TPU 这样的专用硬件非常重要,TPU 是为批量同步训练而设计的。像 JAX 这样的框架更专注于 ML 工作负载,具有便于分析 ML 性能可解释性的功能,例如用于即时编译的高级跟踪。在 ML 舰队中,JAX 的使用随着时间的推移而增加,这很可能归因于这些功能以及更侧重于 ML 的工作负载的出现(Frostig 等人,2018)。
Also, ML frameworks often provide auxiliary services to improve efficiency of the entire ML fleet. For instance, TensorFlow’s tf.data (Murray et al., 2021) service optimizes the performance of the data pipeline. These features, while abstracted from the user, can impact the overall system efficiency, as shown in Figure 5. Underneath these high-level frameworks lies a foundation of general-purpose libraries and datacenter services. Frameworks like TensorFlow utilize libraries such as gRPC (Talwar, 2016), protobuf (Varda, 2008), and tcmalloc (Sanjay Ghemawat, n. d.) for various low-level operations, and interface with datacenter services for storage (e.g., Colossus (Ghemawat et al., 2003) (Hildebrand and Serenyi, 2021)) and monitoring (e.g., Monarch (Adams et al., 2020)). 此外,ML 框架通常提供辅助服务以提高整个 ML 集群的效率。例如,TensorFlow 的 tf.data 服务(Murray 等人,2021)优化了数据管道的性能。这些功能虽然对用户来说是抽象的,但会影响整体系统效率,如图 5 所示。在这些高级框架之下,是一般用途库和数据中心服务的基础。像 TensorFlow 这样的框架利用 gRPC(Talwar,2016)、protobuf(Varda,2008)和 tcmalloc(Sanjay Ghemawat,n. d.)等库进行各种低级操作,并与数据中心服务接口进行存储(例如,Colossus(Ghemawat 等人,2003)(Hildebrand 和 Serenyi,2021))和监控(例如,Monarch(Adams 等人,2020))。
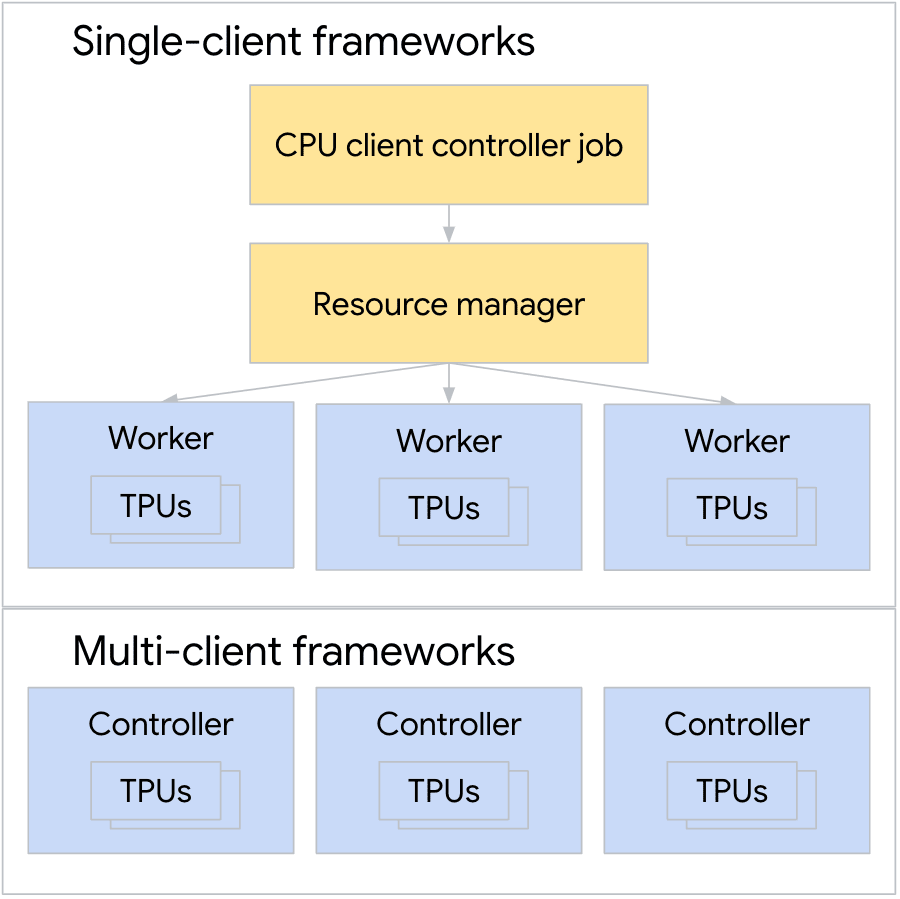
Figure 7. Comparing single-client frameworks with multi-client frameworks. 图 7. 比较单客户端框架与多客户端框架 As the primary point of interaction for users, the framework layer serves as a key bridge in the ML system stack, as it not only abstracts underlying complexities but also plays an important role in determining the overall efficiency and capabilities of the fleet. Frameworks must balance the need for user-friendly APIs with the need to leverage underlying hardware-specific optimizations, while also managing the complexities of distributed computing, data pipeline optimization, and integration with lower-level services. 作为用户的主要交互点,框架层在 ML 系统堆栈中充当关键桥梁,它不仅抽象了底层复杂性,还在决定整个机群的效率和功能方面发挥着重要作用。框架必须在用户友好的 API 需求与利用底层特定硬件优化需求之间取得平衡,同时还要管理分布式计算、数据管道优化以及与较低级别服务的集成等复杂性。
To characterize the ML Fleet at the highest level of the stack, we want to know: What types of workloads are we spending most of our compute cycles on? This is a critical question because it drives nearly every design decision we make for the ML Fleet at every level of the stack, from the hardware (how many training vs. inference vs. other chips) to the software (JAX vs. other frameworks, runtime distribution strategies, and compiler optimizations). Workload heterogeneity analysis is useful for understanding what kind of models are prevalent in the production fleet, especially since different workloads stress the hardware in different ways. This understanding can drive decisions about which accelerators to deploy and how many, or which compiler optimizations to carry out. 为了在最高层级上表征 ML 集群,我们想要了解:我们大部分计算周期都花在了哪些类型的任务上?这是一个关键问题,因为它驱动了我们在每个层级上为 ML 集群做出的几乎所有设计决策,从硬件(训练芯片与推理芯片的比例)到软件(JAX 与其他框架、运行时分配策略和编译器优化)。任务异构性分析有助于了解生产集群中流行的模型类型,特别是由于不同的任务以不同的方式对硬件产生压力。这种理解可以驱动关于部署哪些加速器以及部署多少,或执行哪些编译器优化的决策。
In practice, we observe that the model and data layer of the ML fleet stack are the most affected by fluctuating user demands. User requirements such as the model architecture, size of the training dataset, or even use of different numerical formats in the training model can impact the efficiency of the job, which can have a cascading effect on the efficiency of the overall ML fleet. 在实践中,我们观察到 ML 集群堆栈中的模型与数据层最受用户需求波动的影响。用户需求,如模型架构、训练数据集的大小,甚至训练模型中使用的不同数值格式,都可能影响作业的效率,进而对整个 ML 集群的效率产生级联效应。
While ML workloads share some computational patterns, particularly in their use of matrix operations and data-intensive processing, the specific architectures and resource requirements can vary significantly. As new model architectures and learning tasks emerge, they prompt rapid shifts in workload composition, leading to fluctuations in resource demands across various model types. 虽然机器学习工作负载在计算模式上存在一些共性,特别是在矩阵运算和数据密集型处理方面,但具体的架构和资源需求可能会有显著差异。随着新的模型架构和学习任务的涌现,工作负载的构成会迅速变化,导致不同模型类型的资源需求出现波动。
In a production ML fleet, there are varying proportions of workloads dedicated to each phase of the ML model life cycle; training, bulk inference, and real-time serving. Thus, the fleet must be flexible enough to handle the requirements of each of these phases; for example, training workloads may be compute intensive while real-time serving workloads may focus on minimizing latency. 在生产环境中的机器学习集群中,分配给机器学习模型生命周期每个阶段的工作负载比例各不相同;包括训练、批量推理和实时服务。因此,集群必须足够灵活,能够满足这些阶段中每个阶段的需求;例如,训练工作负载可能计算密集型,而实时服务工作负载可能侧重于最小化延迟。
The optimization of ML fleet efficiency is a complex, cyclical challenge, as illustrated in Figure 3. The first challenge is measuring, understanding, and reporting fleetwide efficiency, establishing a baseline for current performance. Second, we must identify and quantify fleet-wide inefficiencies, pinpointing areas that require improvement. Third, we must eliminate these inefficiencies by implementing changes across the fleet, which in turn leads back to the first stage as we measure the impact of these changes. This cycle ensures ongoing optimization and adaptation to the ever-evolving landscape of ML workloads and hardware. To keep pace with this lifecycle, we require a metric that not only quantifies current performance but also guides optimization efforts across the fleet. ML 集群效率的优化是一个复杂且循环的挑战,如图 3 所示。第一个挑战是测量、理解和报告集群范围内的效率,为当前性能建立基准。其次,我们必须识别和量化集群范围内的低效问题,找出需要改进的领域。第三,通过在整个集群中实施变更来消除这些问题,而这些变更的影响又反过来带回到第一个阶段,我们测量这些变更的影响。这个循环确保了持续优化和适应不断发展的 ML 工作负载和硬件环境。为了跟上这个生命周期,我们需要一个不仅能够量化当前性能,还能指导整个集群优化工作的指标。
In this section, we present an in-depth discussion of MPG, a new metric for quantifying ML fleet efficiency. We refer to this as the iron law of performance for ML fleets, drawing a corollary to the iron law of processor performance (Emer and Clark, 1984). MPG, defined in Figure 8, is a means for measuring efficiency gains and guiding exploration of optimization strategies across various fleet components. 在本节中,我们深入讨论了 MPG,一种用于量化 ML 集群效率的新指标。我们将其称为 ML 集群的性能铁律,并由此引申出处理器性能铁律的推论(Emer 和 Clark,1984)。如图 8 所示定义的 MPG,是一种衡量效率提升和指导探索优化策略的手段,适用于集群的各个组件。
Ideally, the MPG metric must be a clearly defined and accurate measure of forward progress; improvements in the metric must also reflect real improvements in the efficiency of the fleet. This metric must be capable of overcoming two significant challenges. 理想情况下,MPG 指标必须是一个明确定义且准确的衡量正向进展的度量;该指标的提升也必须反映车队效率的真实改进。这个指标必须能够克服两个重大挑战。
It must capture the dynamic nature of ML fleets: The fleet is constantly fluctuating due to variables such as changes in workload composition, updates to the code stack, and evolving hardware. To effectively improve efficiency, we must ensure that any change in the metric is explainable despite these fluctuating variables. 它必须捕捉 ML 车队的动态特性:车队由于工作负载组成的变化、代码堆栈的更新以及硬件的演进等因素而不断波动。为了有效提升效率,我们必须确保尽管存在这些波动变量,指标中的任何变化都是可解释的。
It must explain the trade-offs between individual and aggregate efficiency. At a fleetwide scale, jobs must be scheduled in concert with one another to ensure maximum aggregate efficiency of the fleet. However, individual jobs may have certain service-level requirements, meaning that this metric must be decomposable based on workload characteristics. 它必须解释个体效率和总体效率之间的权衡。在全局规模上,任务必须协同调度以确保整个机群的最高总体效率。然而,单个任务可能具有特定的服务等级要求,这意味着该指标必须根据工作负载特性进行分解。
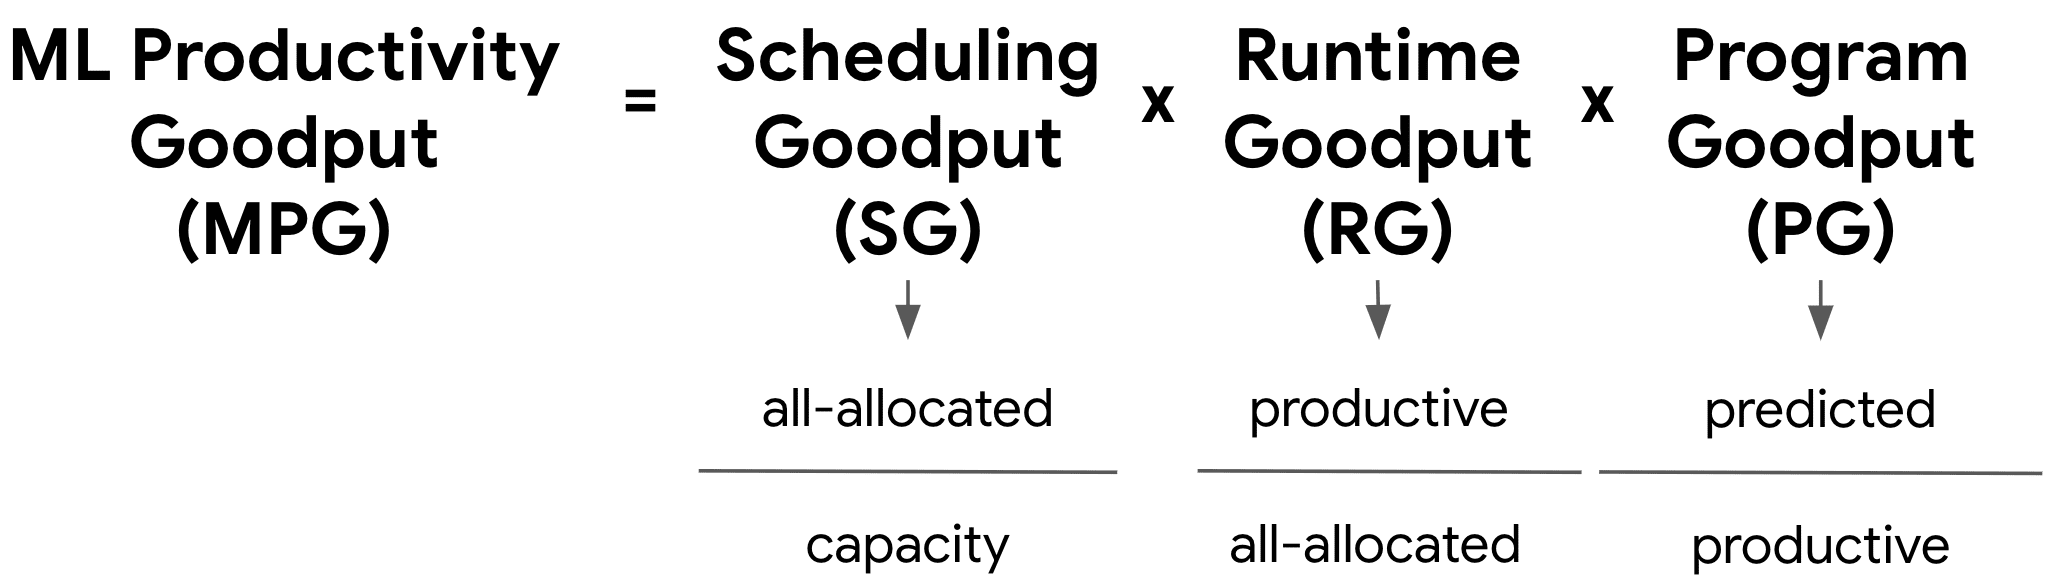
ML Productivity Goodput (MPG) is designed to address the myriad challenges discussed in Section 3, as well as to overcome the limitations of existing approaches. Just as the Iron Law of Processor Performance (Emer and Clark, 1984) breaks down CPU performance into $\frac{\text{instructions}}{\text{program}}\times\frac{\text{cycles}}{\text{instruction}} \times\frac{\text{time}}{\text{cycle}}$, the MPG metric decomposes ML fleet efficiency into scheduling, runtime, and program components (see Figure 8). ML 生产力吞吐量(MPG)旨在解决第 3 节中讨论的众多挑战,并克服现有方法的局限性。正如处理器的性能铁律(Emer 和 Clark,1984)将 CPU 性能分解为 $\frac{\text{instructions}}{\text{program}}\times\frac{\text{cycles}}{\text{instruction}}\times\frac{\text{time}}{\text{cycle}}$,MPG 指标将 ML 队列效率分解为调度、运行时和程序组件(见图 8)。
This multi-layered structure, as shown in Figure 9, offers several advantages over traditional metrics. First, it allows precise identification of performance bottlenecks or improvements at specific layers of the stack, facilitates a more granular analysis of efficiency trends over time, and mitigates the risk of misleading interpretations that can arise from aggregated data. Second, by decoupling these submetrics, we enable more targeted optimization efforts and gain deeper insights into the complex interactions within the ML fleet. Finally, this approach not only enhances our ability to measure current performance but also provides a framework for guiding improvements, discussed in Section 5. 这种多层结构,如图 9 所示,相较于传统指标具有多个优势。首先,它允许精确识别堆栈中特定层级的性能瓶颈或改进点,促进对效率趋势的更细粒度分析,并降低因聚合数据而产生的误导性解释风险。其次,通过解耦这些子指标,我们能够实现更具针对性的优化工作,并深入洞察 ML 舰队内部的复杂交互。最后,这种方法不仅增强了我们衡量当前性能的能力,还提供了一个指导改进的框架,详见第 5 节。
Scheduling Goodput: How often does an application have all necessary resources to make progress? 调度产出率:应用程序多久才能获得所有必要资源以继续进行?
Scheduling Goodput (SG) quantifies the efficiency of resource allocation in an ML fleet. It measures the fraction of time that an application has all the required resources simultaneously available to make progress. This metric can be lower than traditional Occupancy metrics, particularly in distributed, bulk-synchronous applications where all required chips must be available concurrently. The numerator of SG is calculated as the simultaneous uptime of all tasks in a distributed ML application that must be connected to make synchronous progress, as shown in Figure 10. This is referred to as “allocated chip-time” or “all-allocated” time. The denominator is fleet capacity, expressed as chip-time. This provides a full view of how effectively the scheduling layer is using the fleet’s resources. 调度产出率(SG)量化了机器学习集群中资源分配的效率。它衡量应用程序在所有所需资源同时可用以推进工作的时间比例。这一指标可能低于传统的占用率指标,特别是在分布式、批量同步的应用中,所有所需芯片必须同时可用。SG 的分子是分布式机器学习应用中所有必须连接以实现同步进度的任务的并发运行时间,如图 10 所示。这被称为“分配的芯片时间”或“全部分配”时间。分母是集群容量,以芯片时间表示。这提供了调度层如何有效利用集群资源的全面视角。
Scheduling Goodput offers insights into potential inefficiencies in resource allocation, such as fragmentation of available resources, delays in coordinating multiple chips for distributed applications, and mismatches between application requirements and available resources. By optimizing SG, we can improve the overall efficiency of resource utilization in the ML fleet, ensuring that applications have the necessary resources to make consistent progress. 调度产出率提供了对资源分配潜在低效的洞察,例如可用资源的碎片化、协调多个芯片以支持分布式应用时的延迟,以及应用需求与可用资源之间的不匹配。通过优化 SG,我们可以提高 ML 舰队中资源利用的整体效率,确保应用拥有必要的资源以保持持续进展。
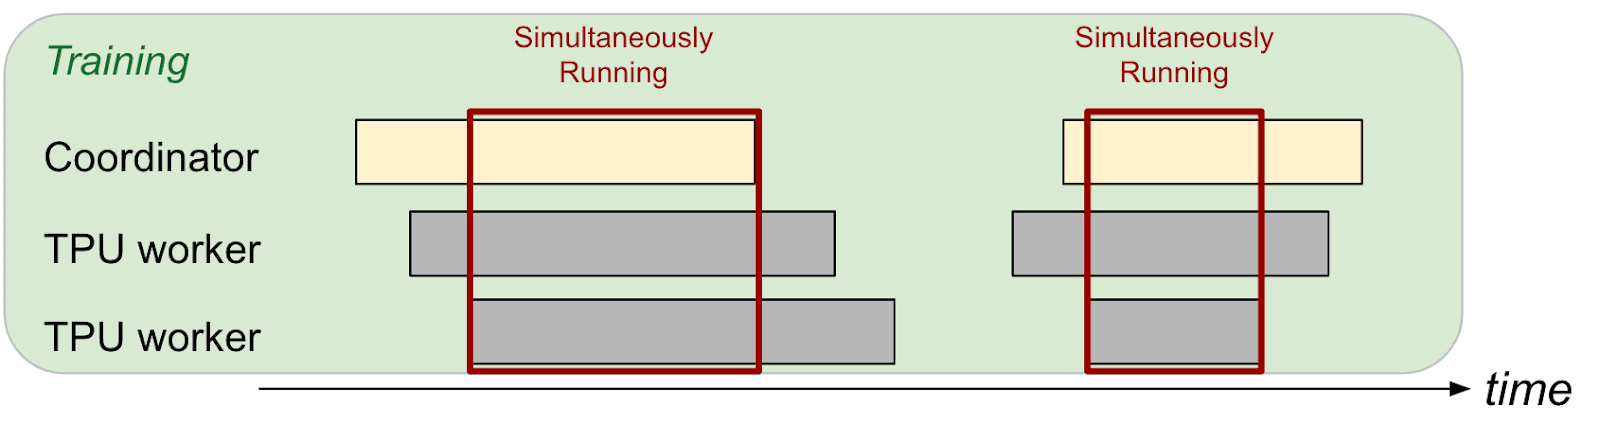
Figure 10.The scheduling goodput for training workloads measures the percentage of time when all of the TPU workers are available to work at the same time. In other words, it measures the portion of time that all of the necessary resources are available to make progress. 图 10. 训练工作负载的调度产出率衡量了所有 TPU 工作者同时可用工作的时间百分比。换句话说,它衡量了所有必要资源可用以推进工作的那部分时间。 Runtime Goodput: Of the time that an application has all necessary resources, how often is it making progress? 运行时产出率:应用程序拥有所有必要资源的时间中,有多少比例是在取得进展?
Runtime Goodput (RG) measures the efficiency of the orchestration layers in managing the execution of ML applications once resources are allocated. This metric focuses on the actual productive time of an application, accounting for various overheads in the runtime environment. The orchestration layer is responsible for critical tasks such as initializing chips, connecting them into slices for bulk-synchronous progress, loading and compiling programs, feeding data to these programs, and ensuring that training progress is regularly saved through checkpoints. The numerator of RG is the productive chip-time of the application’s progress that has been saved in checkpoints; work done between the last checkpoint and failure (or preemption) doesn’t count as ”productive” time and is therefore not included in RG. The denominator of RG is the allocated chip-time defined as the numerator of SG. 运行时产出率(RG)衡量资源分配后,编排层管理 ML 应用执行效率。该指标关注应用的实际有效时间,考虑运行时环境的各种开销。编排层负责初始化芯片、将芯片连接成片进行批量同步推进、加载和编译程序、向程序提供数据,以及通过检查点确保训练进度定期保存。RG 的分子是已保存于检查点的应用进度的有效芯片时间;最后一次检查点到失败(或抢占)期间完成的工作不计为"有效"时间,因此不包含在 RG 中。RG 的分母是分配的芯片时间,定义为 SG 的分子。
Runtime Goodput can help with identifying bottlenecks in the runtime environment, such as slow data loading, inefficient checkpointing, or suboptimal program compilation. It can guide the efforts to streamline the execution pipeline and improve the overall throughput of ML workloads. 运行时产出率有助于识别运行时环境中的瓶颈,如数据加载缓慢、检查点效率低下或程序编译不理想。它可以指导优化执行管道的努力,提高 ML 工作负载的整体吞吐量。
Program Goodput: Of the time that an application is making progress, how close is it to the ideal roofline? 程序产出率:在应用程序取得进展的时间内,它接近理想上限的程度如何?
Program Goodput (PG) assesses the efficiency of the application code itself, measuring how effectively it utilizes the available computational resources. While a traditional roofline performance model (Williams et al., 2009) might seem suitable for this purpose, it falls short in capturing the true efficiency of modern ML workloads. The traditional roofline model is highly sensitive to compiler decisions, such as how ML operators are fused or rematerialized (Briggs et al., 1992), or which operands are placed in which memory space. It rewards individual ops that are close to peak utilization, but penalizes correct optimizations that result in computation graphs where the utilization may be lower, but overall execution time is shorter. 程序产出率(PG)评估应用程序代码本身的效率,衡量其有效利用可用计算资源的能力。虽然传统的屋顶线性能模型(Williams 等人,2009 年)似乎适合此目的,但它无法捕捉现代机器学习工作负载的真实效率。传统的屋顶线模型对编译器决策非常敏感,例如机器学习算子如何融合或重新计算(Briggs 等人,1992 年),或者哪些操作数放置在哪个内存空间中。它奖励接近峰值利用率的单个操作,但惩罚正确优化导致计算图中利用率可能较低,但整体执行时间更短的情况。
To overcome these limitations, we use a compute-based roofline model that compares the ideal execution time of the workload against its actual execution time. The ideal predicted execution time, which is the numerator of PG, can be computed from intrinsic properties of the machine learning model being run. By analyzing the shape of the unoptimized high-level operations (HLO) graph, we can estimate how many floating point operations (FLOPs) the program would require at its theoretical peak performance. Since we are analyzing the computation graph before any compiler optimizations, this prediction is agnostic to compiler decisions. 为了克服这些限制,我们使用基于计算的屋顶线模型,该模型将工作负载的理想执行时间与其实际执行时间进行比较。理想预测执行时间,即 PG 的分子,可以根据正在运行的学习模型的内在属性进行计算。通过分析未优化的高级操作(HLO)图的形状,我们可以估计程序在理论峰值性能下需要多少浮点运算(FLOPs)。由于我们在任何编译器优化之前分析计算图,因此这种预测与编译器决策无关。
The denominator of PG is the actual execution time. The PG metric can thus be interpreted as a percentage reflecting how well optimized the ML program is, with a score of 100% indicating perfect performance matching the theoretical peak. PG 的分母是实际执行时间。因此,PG 指标可以解释为反映 ML 程序优化程度的百分比,其中 100%的分数表示完美匹配理论峰值性能。
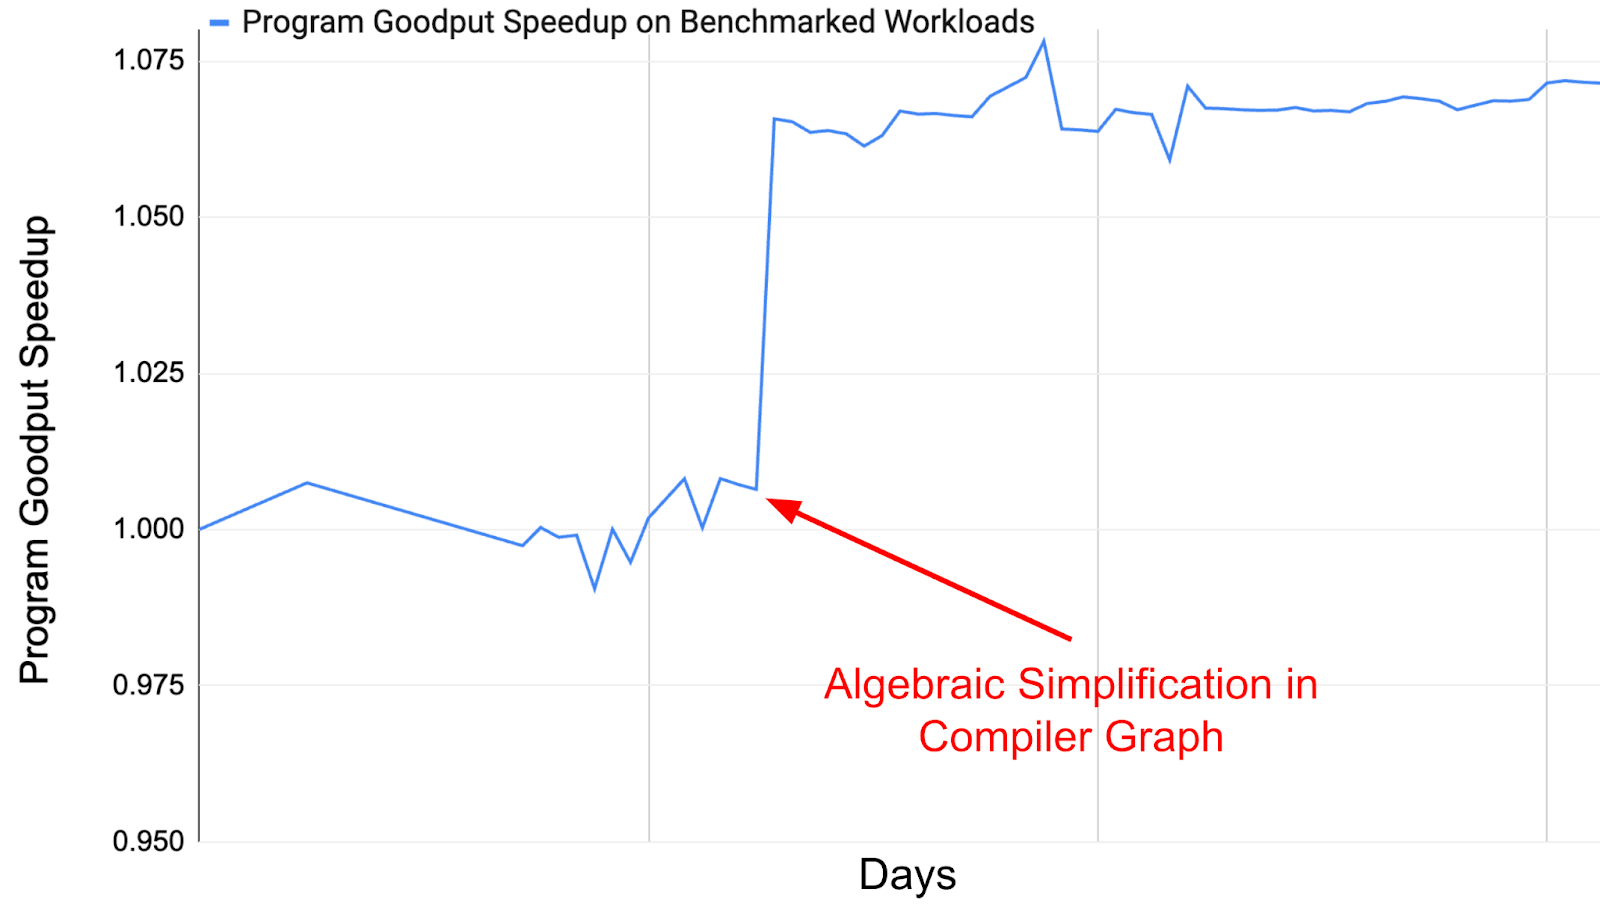
Figure 11.This figure demonstrates the effect of an XLA algebraic simplification optimization on Program Goodput (PG) across a benchmark of the top 150 fleet workloads. Looking at the PG in this way allows us to bisect which code changes improved or regressed overall fleet efficiency. 图 11. 该图展示了 XLA 代数简化优化对 150 个顶级集群工作负载基准测试中的程序产出率(PG)的影响。通过这种方式查看 PG,使我们能够分析哪些代码更改提高了或降低了整体集群效率。
We show how ML Productivity Goodput is a robust quantifier of ML Fleet performance through optimization examples from Google’s ML Fleet in production. We present a breakdown of the MPG components using segmented fleet data and demonstrate how this procedure can help identify potential optimization techniques. Additionally, we showcase the effects of deploying these optimizations and how MPG helps verify and track performance improvements. 我们通过 Google 生产中 ML Fleet 的优化案例,展示了 ML 生产力产出(ML Productivity Goodput)如何成为 ML Fleet 性能的稳健量化指标。我们使用分段 Fleet 数据对 MPG 组件进行分解,并演示了这一过程如何帮助识别潜在的优化技术。此外,我们展示了部署这些优化的效果,以及 MPG 如何帮助验证和跟踪性能改进。
Looking at the aggregated MPG of the fleet does not necessarily help ML practitioners identify what kinds of improvements will make the largest impact on the fleet; this is where the decomposability of the metric comes into play, as shown in Table 2. By breaking MPG into its three components; Scheduling Goodput, Runtime Goodput, and Program Goodput, we can diagnose fleetwide issues and identify the types of optimizations that would most improve fleet efficiency. Furthermore, we can segment the fleet using the characteristics described in Section 3 in order to identify issues with specific workload types and propose model-level optimizations. 查看 Fleet 的汇总 MPG 并不一定能帮助 ML 从业者识别哪些改进将对 Fleet 产生最大影响;这正是该指标的分解性发挥作用的地方,如表 2 所示。通过将 MPG 分解为其三个组件——调度产出(Scheduling Goodput)、运行时产出(Runtime Goodput)和程序产出(Program Goodput),我们可以诊断 Fleet 范围内的問題,并识别出最能有效提升 Fleet 效率的优化类型。此外,我们可以使用第 3 节中描述的特征对 Fleet 进行分段,以识别特定工作负载类型的问题,并提出模型级别的优化方案。
Table 2.Optimizing different components of ML Productivity Goodput. 表 2. 优化 ML 生产力吞吐量的不同组件
| ML Fleet Stack Layer ML 舰队堆栈层 |
Optimization Effect 优化效果 |
Program Goodput 程序产出率 |
Runtime Goodput 运行时产出率 |
Scheduling Goodput 调度产出率 |
Workload ML Productivity Goodput 工作负载 ML 生产力吞吐量 |
|---|---|---|---|---|---|
| Compiler 编译器 |
On-duty step time decreases 在岗步骤时间减少 |
Increases 增加 |
Decreases if device-bound 如果设备绑定则减少 No change if host-bound 如果主机绑定则无变化 |
Decreases if host-bound 如果主机绑定则减少 |
Increases if device-bound 如果设备绑定则增加 No change if host-bound 如果主机绑定则不变 |
| Runtime 运行时 |
Off-duty time or preemption waste decreases 非工作时间或抢占浪费减少 |
No change 无变化 |
Increases 增加 |
Decreases 减少 |
Increases 增加 |
| Scheduler 调度器 |
Partially-allocated time decreases 部分分配时间减少 |
No change 无变化 |
No change 无变化 |
Increases 增加 |
Increases 增加 |
The optimization of Scheduling Goodput (SG) can be presented as a bin packing problem, as described in subsection 3.2. Users launch workloads with varying TPU topology sizes, and the scheduling algorithm must determine how to best fit these workloads into the existing fleet of allocated chips. This process presents numerous challenges, primarily due to the wide variety of job sizes in the fleet, ranging from single-chip to multipod configurations (Kumar et al., 2021). 调度产出(SG)的优化可以表述为一个装箱问题,如 3.2 小节所述。用户启动具有不同 TPU 拓扑尺寸的工作负载,调度算法必须确定如何将这些工作负载最佳地适配到已分配芯片的现有舰队中。这个过程存在许多挑战,主要是由于舰队中工作负载尺寸的多样性,从单芯片到多舱配置不等(Kumar 等人,2021 年)。
A significant complication in job scheduling is that it requires more than mere availability in the fleet. The topology of the available hardware must also satisfy the topology requirements of the workload, which is sometimes impossible without first pre-empting other jobs. Consequently, suboptimal scheduling can have a cascading effect on other components of ML Productivity Goodput. 在任务调度中的一个重要复杂问题是,它不仅需要集群中有可用资源,还需要可用的硬件拓扑结构满足工作负载的拓扑要求,有时在不抢占其他任务的情况下这是不可能的。因此,次优调度会对 ML Productivity Goodput 的其他组件产生级联效应。
We can identify availability issues in the ML Fleet by looking at the SG for jobs with different chip allocation requirements, as shown in Figure 12. The data shows that the overall SG is already close to optimal, due to defragmentation techniques and scheduling optimizations. However, it is interesting to note which jobs tend to have the highest SG: extra-large jobs which require the greatest number of chips or possibly multiple TPU pods, as well as smaller jobs which require only a single chip or a few chips. 我们可以通过查看具有不同芯片分配需求任务的 SG 来识别 ML 集群中的可用性问题,如图 12 所示。数据显示,由于碎片整理技术和调度优化,整体 SG 已经接近最优。然而,值得注意的是哪些任务往往具有最高的 SG:需要最多芯片的大型任务,或者可能需要多个 TPU Pod 的任务,以及只需要单个芯片或少量芯片的小型任务。
This is likely due to the way the scheduler deals with evictions; evicting extremely large jobs would have a severe negative impact on the overall ML Productivity Goodput score due to their huge startup overhead. Once the extra-large job is running, it is also immensely dependent on checkpointing and data sharding, affecting the Runtime and Program Goodput components as well. In short, evicting extra-large jobs from the hardware would present a cascading series of failures, strongly incentivizing the scheduler to reduce churn for these jobs and evict medium-sized jobs instead. 这可能是由于调度器处理驱逐任务的方式造成的;驱逐非常大的任务会对整体 ML 生产力 Goodput 分数产生严重的负面影响,因为它们巨大的启动开销。一旦额外大的任务开始运行,它也极大地依赖于检查点和数据分片,从而影响运行时和程序 Goodput 组件。简而言之,从硬件中驱逐额外大的任务会引发一系列连锁故障,这强烈激励调度器减少这些任务的周转率,转而驱逐中等大小的任务。
On the other hand, extremely small jobs usually do not get prematurely evicted since they are more likely to finish quickly, and if pre-empted, it is usually quicker to find topologically matching availability. With extremely small jobs, the scheduler has more flexibility to intelligently allocate the workloads to optimal compute cells in order to defragment the overall ML fleet availability. It is also important to note that for workloads of all sizes, the SG is greater than 95% due to the particular pre-emption preferences of the scheduler. The pre-emption preferences of the scheduler can be tuned, e.g. to require a SG of greater than 95% for medium-sized jobs, but this could reduce the SG for other segments of the fleet. 另一方面,极小的工作通常不会被过早驱逐,因为它们更有可能快速完成,如果被抢占,通常也更容易找到拓扑匹配的可用性。对于极小的工作,调度器有更大的灵活性,可以智能地将工作负载分配到最佳的计算单元,以减少整体 ML 机群的碎片化。还需要注意的是,由于调度器的特定抢占偏好,所有规模的工作负载的 SG 都大于 95%。调度器的抢占偏好可以调整,例如要求中等规模的工作的 SG 大于 95%,但这可能会降低机群其他部分的 SG。
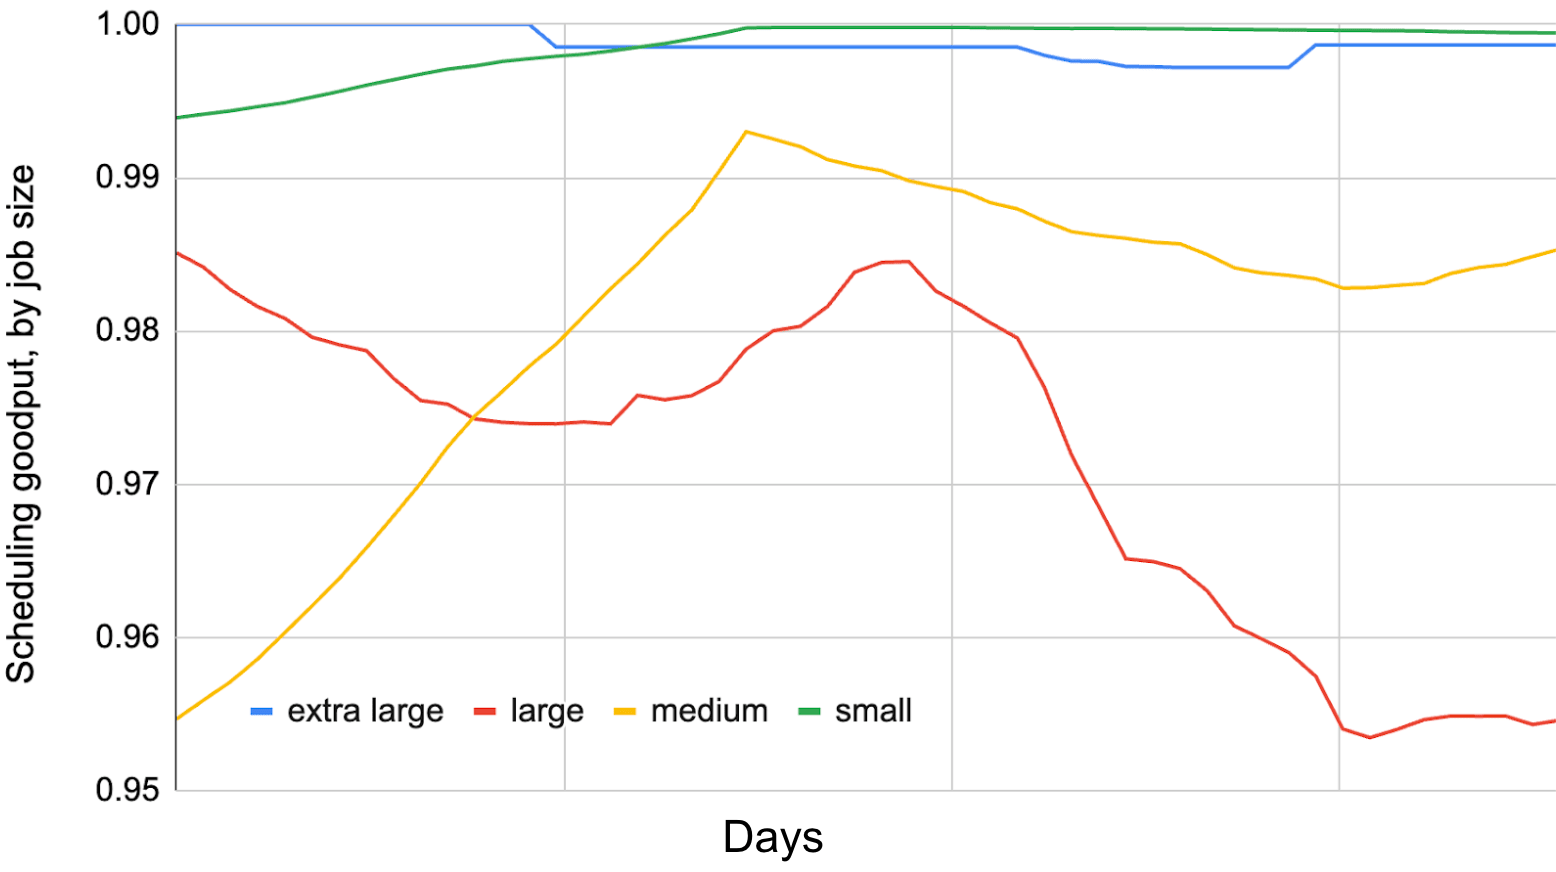
Figure 12.Scheduling goodput by job size. Extra-large and small jobs tend to have better scheduling goodput due to the scheduler’s preemption algorithm. 图 12.按工作规模划分的调度产出。由于调度器的抢占算法,超大和极小的工作往往具有更好的调度产出。
Outside of device time, host overhead and pre-emptions can be major bottlenecks for some workloads, and can be tracked by measuring Runtime Goodput. For example, training jobs usually use input pipelines to ingest and transform input data, which could be bottlenecks for certain models that ingest large amounts of data. Some solutions have been proposed to reduce host overhead, such as Plumber (Kuchnik et al., 2022), a tool to find bottlenecks in ML input pipelines. 除了设备时间外,主机开销和抢占可能会成为某些工作负载的主要瓶颈,可以通过测量运行时产出来追踪这些问题。例如,训练作业通常使用输入管道来摄取和转换输入数据,这对摄取大量数据的某些模型来说可能成为瓶颈。已经提出了一些解决方案来减少主机开销,例如 Plumber(Kuchnik 等人,2022 年),这是一个用于在 ML 输入管道中查找瓶颈的工具。
We can improve the RG of the ML fleet with asynchronous strategies such as sharding the dataflow graph, as proposed by Pathways (Barham et al., 2022). The segmented analysis of RG shows that the particular workloads on Pathways tend to have higher RG scores over time, validating the benefits of Pathways for our particular ML Fleet. Also, techniques such as asynchronous checkpointing (Maurya et al., 2024; Nicolae et al., 2020) can reduce the time spent fetching previous model training checkpoints where the accelerators temporarily pause training and are completely idle. 我们可以通过异步策略来提高 ML 集群的产出,例如将数据流图分片,正如 Pathways(Barham 等人,2022 年)所提出的那样。分段分析产出表明,Pathways 上的特定工作负载随着时间的推移往往具有更高的产出分数,这验证了 Pathways 对我们特定 ML 集群的益处。此外,异步检查点等技术(Maurya 等人,2024 年;Nicolae 等人,2020 年)可以减少加速器暂时暂停训练并完全空闲时检索先前模型训练检查点所花费的时间。
Other strategies, such as ahead-of-time compilation, where programs are compiled on less expensive hardware such as CPUs and then executed on TPUs, can also improve RG. By offloading compilation to a less expensive chip and storing the results in a compilation cache, we can reduce the total runtime of more specialized accelerators. These techniques are often implemented in common ML frameworks, such as TensorFlow (OpenXLA, n. d.) and JAX (JAX, n. d.). 其他策略,如提前编译,其中程序在较便宜的硬件(如 CPU)上编译,然后在 TPU 上执行,也可以提高 RG。通过将编译工作卸载到较便宜的芯片,并将结果存储在编译缓存中,我们可以减少更专业加速器的总运行时间。这些技术通常在常见的 ML 框架中实现,例如 TensorFlow(OpenXLA,n. d.)和 JAX(JAX,n. d.)。
To demonstrate the benefits of these framework-specific optimizations, we can examine the RG of the ML Fleet at the framework level of the system stack described in Figure 3. This can help us understand which frameworks or runtime strategies may be better suited for which workloads. Figure 13 shows RG scores from a sample of Google’s ML fleet for internal workloads, segmented based on characteristics such as model architecture, product area or workload phase (training, real-time serving, or bulk inference), and compared to a baseline of top fleet workloads. Although the segments in Figure 13 are not explicitly identified, we demonstrate how segmenting RG based on workload characteristics (Segment A, Segment B, and Segment C) can reveal trends that would otherwise be hidden by aggregate fleet metrics (represented by the ”Top Fleet Workloads” segment). For example, training workloads running JAX with Pathways may tend to have a higher RG, possibly due to the fact that Pathways is single-client (Barham et al., 2022) and therefore better optimized for training than multi-client frameworks. 为了展示这些框架特定优化的好处,我们可以考察图 3 中系统堆栈的框架层级的 ML Fleet 的 RG。这有助于我们理解哪些框架或运行时策略可能更适合哪些工作负载。图 13 展示了基于模型架构、产品领域或工作负载阶段(训练、实时服务或批量推理)等特征对谷歌 ML Fleet 内部工作负载样本的 RG 分数进行分段的比较结果,并与顶级 Fleet 工作负载的基线进行了对比。尽管图 13 中的分段没有明确标识,但我们展示了如何根据工作负载特征(分段 A、分段 B 和分段 C)对 RG 进行分段,从而揭示由“顶级 Fleet 工作负载”这一聚合 Fleet 指标所掩盖的趋势。例如,使用 JAX 和 Pathways 运行训练工作负载可能倾向于具有更高的 RG,这可能是由于 Pathways 是单客户端(Barham 等人,2022 年)并且因此比多客户端框架更适合训练。
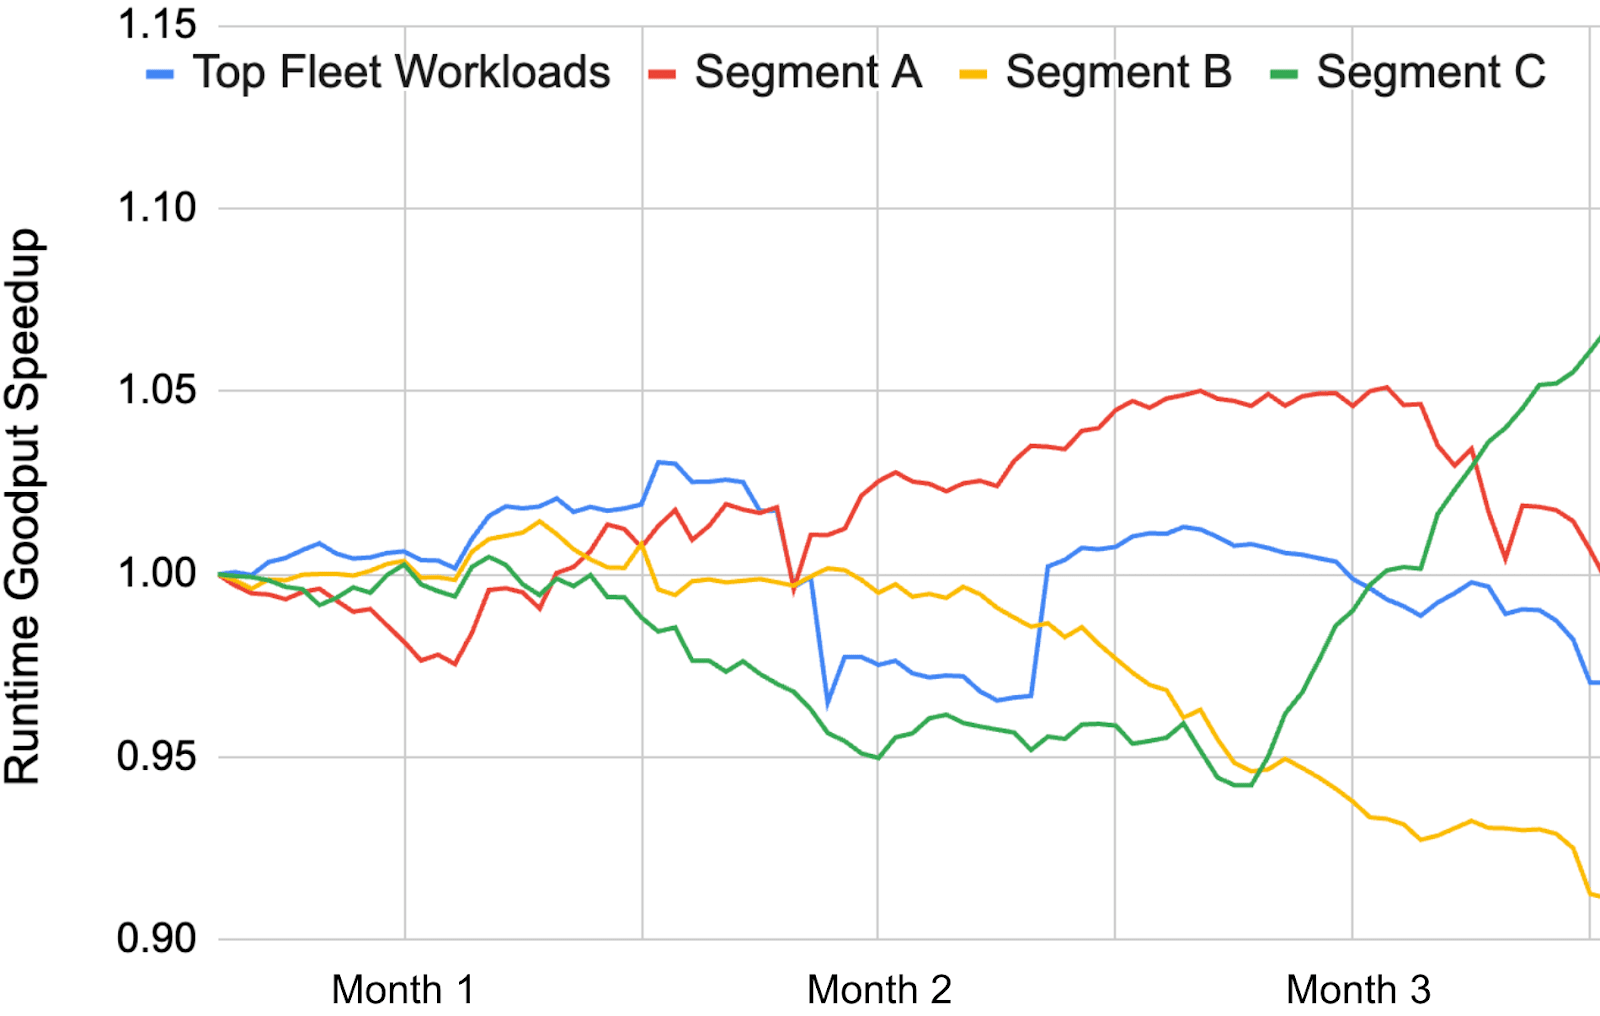
Figure 13.Runtime goodput speedups over the course of one quarter, segmented by fleet workload types. Speedup is normalized to the top N workloads in the fleet, measured at the beginning of the quarter. 图 13 展示了在一个季度内,按舰队工作负载类型划分的运行时产出速率加速情况。加速比被归一化到季度初舰队中排名前 N 的工作负载。
Examining the data along a different axis, training versus real-time serving versus bulk inference, can also be helpful. Using a sample from Google’s ML fleet, Figure 14 illustrates that training workloads tend to have a higher RG than serving workloads. This is most likely due to the inherently different nature of serving and training. Typically, training workloads have more constant computational demands, while real-time serving can fluctuate based on user demand. The slight decrease in serving RG can be attributed to transitory demands on the fleet, but it remains relatively stable in comparison to the bulk inference segment. The huge fluctuation in RG for bulk inference highlights the changing nature of production fleet demands. Previously, the bulk inference segment of the fleet was dominated by workloads running on a single core, where each chip contained a replica of the model, resulting in more easily accessible checkpoints/data and less accelerator wait time. However, as we move to larger models, the weights must be sharded across multiple chips, resulting in more expensive data reads. Additionally, the rise of expert-based models (Shazeer et al., 2017) has made bulk inference runtime much more complex to optimize, as some machines must wait for others for distillation of weight updates in a student-teacher model. This has resulted in an temporary decrease of RG for the bulk inference segment between ”Month 3” and ”Month 6” of Figure 14. This example illustrates how analyzing disaggregated RG can allow ML fleet architects to make informed decisions about their runtime stack by pinpointing segments that may be more susceptible to shifting fleet demands. 从不同的维度分析数据,例如训练与实时服务与批量推理,也可能有所帮助。使用来自 Google 机器学习集群的样本,图 14 表明训练工作负载的 RG 通常高于服务工作负载。这很可能是因为服务和训练的内在性质不同。通常,训练工作负载具有更稳定的计算需求,而实时服务可以根据用户需求波动。服务 RG 的轻微下降可归因于集群的暂时性需求,但与批量推理部分相比,它仍然相对稳定。批量推理的 RG 巨大波动突出了生产集群需求的变化性质。以前,集群的批量推理部分主要由在单个核心上运行的工作负载主导,其中每个芯片都包含模型的副本,导致更容易访问检查点/数据,并减少加速器等待时间。然而,随着我们转向更大的模型,权重必须在多个芯片之间分片,导致更昂贵的读取数据。 此外,基于专家模型的兴起(Shazeer 等人,2017 年)使得批量推理运行时优化变得更加复杂,因为在师生模型中,某些机器必须等待其他机器进行权重更新的蒸馏。这导致图 14 中“第 3 个月”到“第 6 个月”的批量推理部分 RG 暂时下降。这个例子说明了通过分析分解后的 RG,机器学习舰队架构师可以就其运行时堆栈做出明智的决策,通过精准定位可能更容易受到舰队需求变化影响的段落。
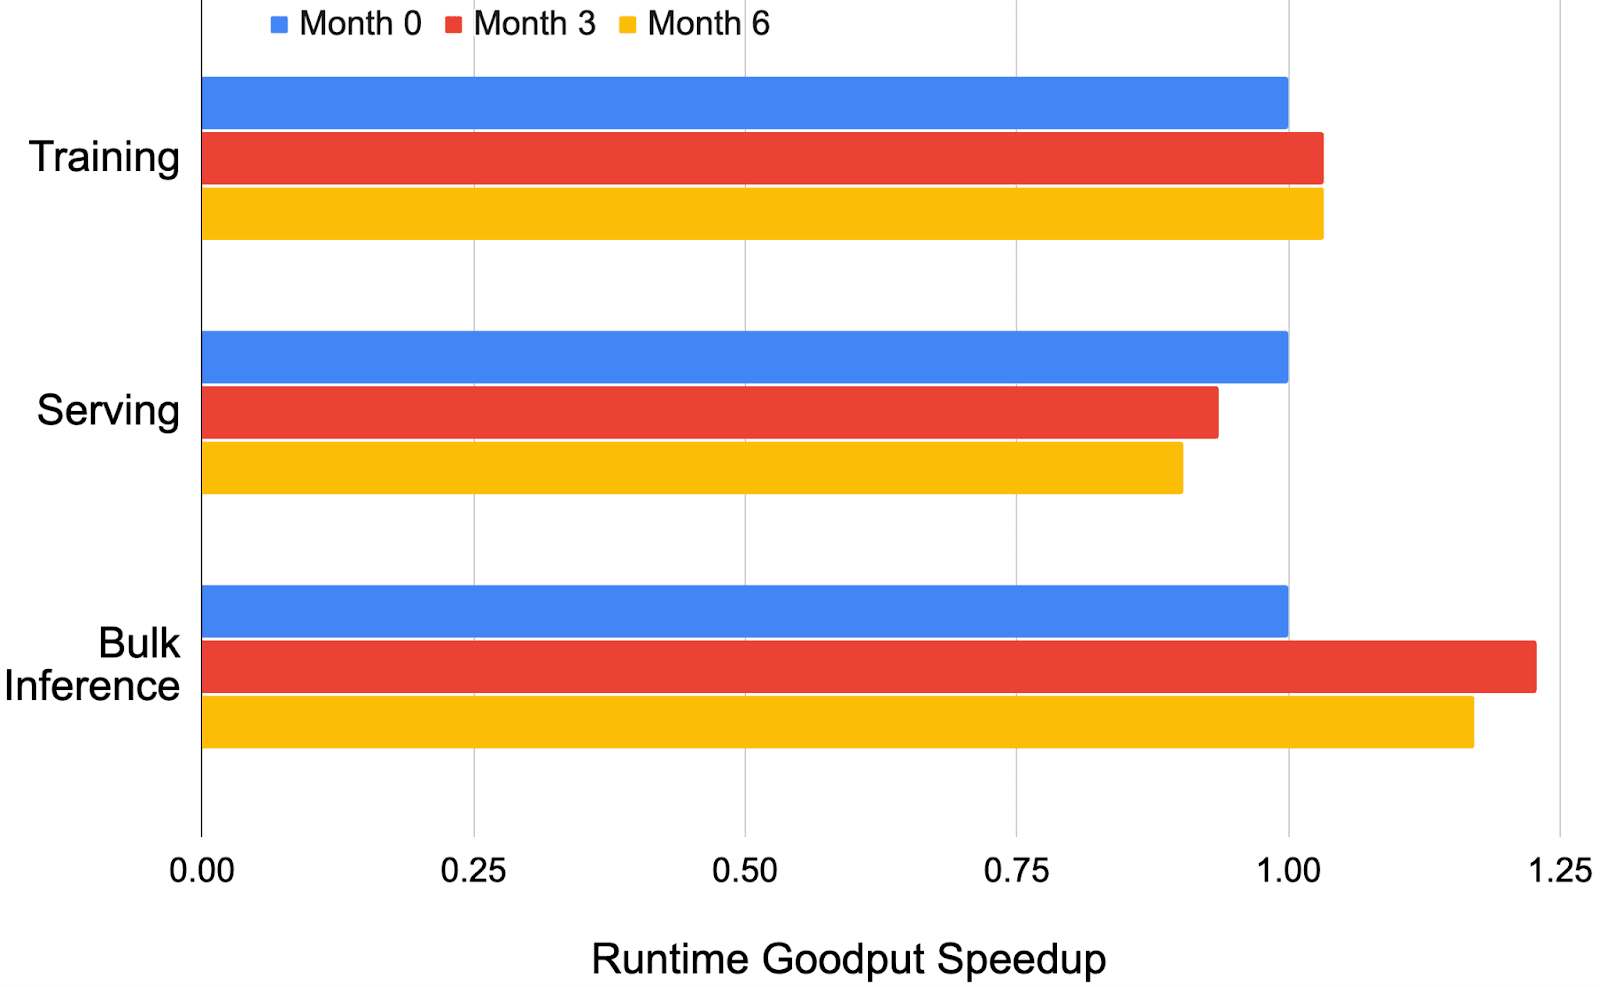
Figure 14.Runtime Goodput trends for a notional slice of a sample ML fleet over a period of six months, segmented by workload phase. 图 14. 样本机器学习舰队中一个假设切片在六个月内的运行产出趋势,按工作负载阶段分段。
We present various techniques and strategies that have been employed at Google over recent years for improving Program Goodput in our ML fleets, ranging from parallelization methods to compiler optimizations. Recall that PG measures the effective utilization of computational resources. As ML models grow in size and complexity, optimizing PG becomes increasingly important to make efficient use of hardware and reduce compute times. With PG instrumentation, we have been able to pinpoint which segments of the fleet require further optimization at the compiler or ML model level. 我们介绍了谷歌近年来在提高 ML 集群程序吞吐量方面采用的各种技术和策略,涵盖了并行化方法到编译器优化等。回想一下,PG(程序吞吐量)衡量的是计算资源的有效利用率。随着 ML 模型的规模和复杂度不断增长,优化 PG 变得越来越重要,这有助于高效利用硬件并减少计算时间。通过 PG 监控,我们能够精准定位到集群中哪些部分需要在编译器或 ML 模型层面进行进一步优化。
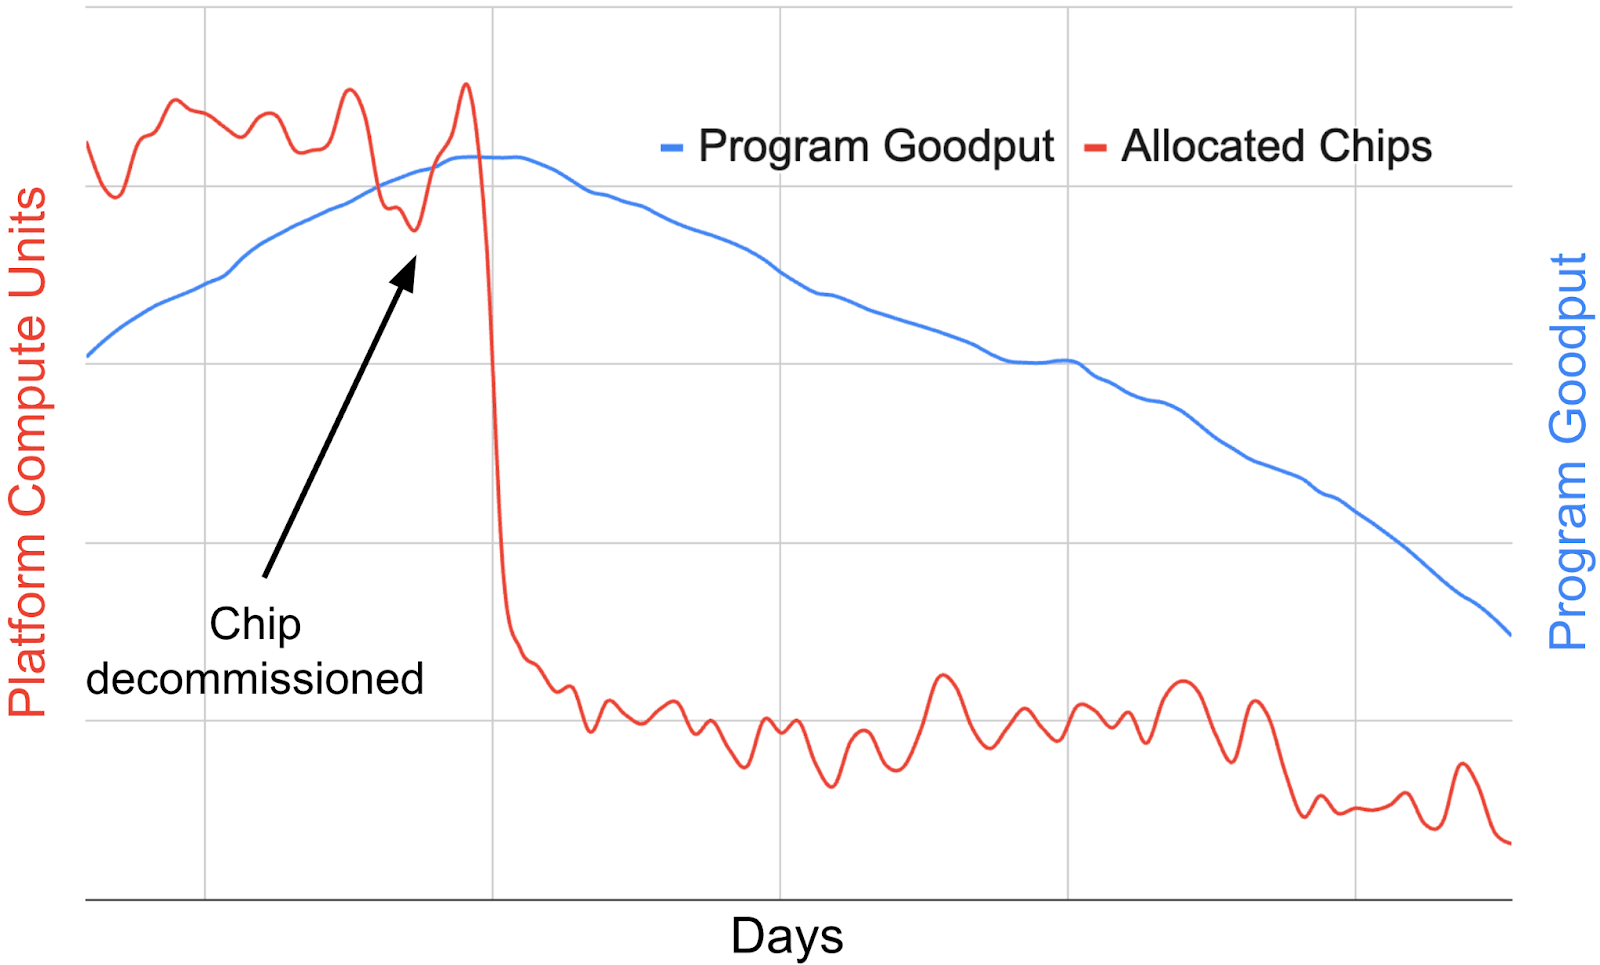
Figure 15.Tracking the Program Goodput (PG) versus allocation trends for a particular domain-specific chip in an ML fleet. Looking at the disaggregated segments of MPG can help reveal fleetwide trends and interactions between different layers in the ML fleet stack, informing future design decisions. 图 15. 追踪特定领域专用芯片在 ML 集群中的程序产出率(PG)与分配趋势。通过分析 MPG 的细分部分,有助于揭示集群级趋势以及 ML 集群堆栈中不同层级的交互,为未来的设计决策提供信息。
Overlapping communication and computation. To identify potential system optimizations that can improve fleet efficiency, we can look at the PG of workloads segmented by performance characteristics. In other words, how many of the workloads in the fleet are compute-bound versus communication-bound? By segmenting the PG in this way, it is possible for us to identify that many high-cost workloads are communication-bound. 重叠的通信与计算。为了识别潜在的系统能够提高集群效率的优化方案,我们可以查看按性能特征划分的工作负载的 PG。换句话说,集群中有多少工作负载是计算受限的,而不是通信受限的?通过这种方式划分 PG,我们可以发现许多高成本的工作负载是通信受限的。
To address this issue at the high-level operation (HLO) level, a technique that overlaps communication with computation was developed and deployed in our production fleet (described in Wang et al. (2022)). This technique decomposes communication collectives, along with the dependent computation operations, into a sequence of finer-grained operations to hide data transfer latency so that better system utilization is achieved. This approach improved the overall system throughput by up to 1.38× and achieves 72% FLOPS utilization on 1024 TPU chips for a large language model with 500 billion parameters (Wang et al., 2022). 为了在高阶操作(HLO)层面解决这一问题,我们已在生产集群(如 Wang 等人(2022)所述)中开发并部署了一种将通信与计算重叠的技术。该技术将通信集合及其相关的计算操作分解为一系列更细粒度的操作,以隐藏数据传输延迟,从而实现更好的系统利用率。这种方法将整体系统吞吐量提高了 1.38×,并在具有 5000 亿参数的大型语言模型上,实现了 1024 个 TPU 芯片的 72% FLOPS 利用率(Wang 等人,2022)。
Compiler autotuning. At the fleet level, we have also developed and deployed optimizations that improve code-generation quality and can be generalized to any workload in the fleet. XTAT (Phothilimthana et al., 2021) is an autotuner for production ML compilers that tunes multiple compiler stages, including tensor layouts, operator fusion decisions, tile sizes and code generation parameters. Evaluated over 150 ML training and inference models on TPUs, XTAT offers speedups over the heavily-optimized XLA compiler in the fleet. 编译器自动调优。在集群层面,我们还开发并部署了能够提升代码生成质量且可推广至集群中任何工作负载的优化措施。XTAT(Phothilimthana 等人,2021)是一款面向生产型机器学习编译器的自动调优器,可调优包括张量布局、算子融合决策、瓦片尺寸和代码生成参数等多个编译阶段。在 TPU 上对 150 多个机器学习训练和推理模型进行评估,XTAT 相较于集群中高度优化的 XLA 编译器提供了显著的加速效果。
Example: Quantifying the impact of an XLA optimization on the TPU fleet. It is rare for any single optimization to have a significant impact on overall fleet-wide PG. But we can track the impact of these optimizations by looking at the change in PG for a fixed set of benchmarked workloads or segment of the production fleet over time. For example, looking at a benchmark of the top 150 most costly workloads in the fleet, Figure 11 pinpoints the effect of a code change that was submitted to the XLA compiler - in this case, an algebraic simplification in the compiler graph. The increase in PG for the benchmark of 150 workloads suggests that the positive impact of this optimization can be generalized to the fleet. 量化 XLA 优化对 TPU 集群的影响。单一优化对整体集群级 PG 产生显著影响的情况很少见。但我们可以通过观察固定一组基准测试工作负载或生产集群某一部分的 PG 随时间的变化来追踪这些优化的影响。例如,查看集群中最耗时的 150 个工作负载的基准测试,图 11 指出了提交给 XLA 编译器的代码变更的影响——在此情况下,是编译器图中的代数简化。150 个工作负载基准测试的 PG 增加表明,这种优化的积极影响可以推广到整个集群。
It is also helpful to look at PG fluctuations across hardware segments of the fleet. Figure 15 shows a notional example where looking at segmented PG can uncover insights that would otherwise be hidden by looking at aggregate metrics. In this case, the segmented data suggests that when a new ML accelerator chip is introduced to the fleet, the workloads running on that chip may initially have a low PG, since the model / compiler code has not been fully tailored for that chip yet. As user adoption increases and accelerator-specific software optimizations are rolled out to the fleet, PG gets closer to theoretical peak efficiency. In other words, accelerator maturity tends to yield greater PG over time. As the chip nears the end of its lifecycle (represented by decreasing allocation in the fleet, and shown in Figure 15 by the “Chip decommissioned” label), the PG decreases due to lower chip usage and natural workload/compiler drift. This shows the importance of co-design across all layers of the ML fleet to make sure that both the software (compiler) and hardware (chips) are optimized for the latest workloads. 观察整个机队中硬件分段的 PG 波动也很有帮助。图 15 展示了一个假设性示例,其中通过查看分段 PG 可以揭示被整体指标隐藏的洞察。在这种情况下,分段数据显示,当新的 ML 加速器芯片被引入机队时,该芯片上运行的工作负载最初可能具有较低的 PG,因为模型/编译器代码尚未完全针对该芯片进行定制。随着用户采用率的提高和针对加速器的特定软件优化在机队中推广,PG 将接近理论峰值效率。换句话说,加速器的成熟度往往随着时间的推移带来更高的 PG。当芯片接近其生命周期末期(由机队中分配减少表示,并在图 15 中通过“芯片退役”标签显示)时,由于芯片使用率降低和自然的工作负载/编译器漂移,PG 会下降。这显示了跨 ML 机队所有层进行协同设计的重要性,以确保软件(编译器)和硬件(芯片)都针对最新工作负载进行了优化。
To put things into perspective for MPG, we considered more traditional approaches to measuring ML fleet efficiency such as Capacity, Occupancy, and Duty Cycle. Figure 16 illustrates how we may have traditionally tended to think about performance metrics (Li et al., 2023; Mars et al., 2011; Kanev et al., 2015). However, our experience reveals that these traditional metrics can sometimes fall short in providing a holistic view, given the unique challenges we have discussed in Section 2 and Section 3. While we cannot provide specific measured details for proprietary reasons, we can share the key insights and lessons learned from our evaluation of these metrics in a production environment. 为了使 MPG 的情况更加清晰,我们考虑了更多传统的衡量 ML 集群效率的方法,如容量、占用率和任务周期。图 16 展示了我们可能传统上如何思考性能指标(Li 等人,2023;Mars 等人,2011;Kanev 等人,2015)。然而,我们的经验表明,考虑到我们在第 2 节和第 3 节讨论的独特挑战,这些传统指标有时可能无法提供全面的视角。虽然由于专有原因,我们无法提供具体的测量细节,但我们可以分享我们在生产环境中对这些指标评估的关键见解和经验教训。
High Capacity equates to high resource availability. While capacity can tell us how many individual accelerators may be available in the fleet at a given time, it does not take into account the topological shape of those accelerators. For example, an ML training workload requesting thousands of chips in a certain physical mesh shape may never be scheduled if the only available accelerators are fragmented across different clusters or data centers. Other factors, such as the geographical location of data storage cells and accelerators, are not included in the capacity metric, even though they significantly affect job scheduling. Therefore, high capacity by itself as a metric does not necessarily effectively translate to high availability for workloads, and we should instead opt for scheduling efficiency as a more robust metric. 高容量意味着高资源可用性。虽然容量可以告诉我们某个时间点集群中可能有多少个单独的加速器可用,但它并未考虑这些加速器的拓扑结构。例如,一个需要数千个芯片并以特定物理网格形状运行的 ML 训练工作负载,如果可用的加速器分散在不同的集群或数据中心,可能永远无法被调度。其他因素,如数据存储单元和加速器的地理位置,虽然它们对作业调度有显著影响,但并未包含在容量指标中。因此,仅凭高容量这一指标并不能有效地转化为高工作负载可用性,我们应该选择调度效率作为更可靠的指标。
High Occupancy guarantees productivity. Occupancy is defined as the fraction of accelerators allocated to jobs and is often measured by the scheduler (e.g. Borg (Verma et al., 2015)). Occupancy is traditionally seen as a key efficiency indicator, but it can be misleading as it masks inefficiencies in the system stack. For example, an accelerator might be successfully allocated but stuck in I/O wait or running poorly optimized code, thus resulting in a high occupancy but very little actual progress being made towards the workload task. This is important for long-running tasks such as ML model training, where frequent pre-emptions may hinder checkpoint progress but still result in a nominally high occupancy. The traditional occupancy metric therefore does not distinguish between productive and unproductive use of allocated resources. 高占用率保证了生产力。占用率被定义为分配给作业的加速器的比例,通常由调度器测量(例如 Borg(Verma 等人,2015 年))。占用率传统上被视为一个关键效率指标,但它可能会产生误导,因为它掩盖了系统栈中的低效问题。例如,一个加速器可能被成功分配,但卡在 I/O 等待状态或运行优化不良的代码,从而导致高占用率,但实际进展却非常有限。这对于像机器学习模型训练这样需要长时间运行的任务非常重要,频繁的中断可能会阻碍检查点进度,但仍然会导致名义上的高占用率。因此,传统的占用率指标无法区分分配资源的有用和无效使用。
Duty Cycle accurately represents useful work. Duty Cycle measures whether an accelerator is in use, not how much of its compute capacity is used. When looking at an ML workload running on a TPU, duty cycle does not provide any signal on how much the matrix-multiply units (MXUs) are utilized (Jouppi et al., 2023). It is agnostic of the program-level efficiency and does not take into account the effectiveness of the operations being performed. An accelerator could have a high duty cycle while executing unnecessary or redundant computations. So, we require a more sophisticated metric. 占空比准确反映了有效工作量。占空比衡量的是加速器是否在使用中,而不是其计算能力的使用程度。当观察在 TPU 上运行的机器学习工作负载时,占空比不会提供任何关于矩阵乘法单元(MXU)利用程度的信号(Jouppi 等人,2023 年)。它对程序级效率是漠不关心的,也不考虑所执行操作的有效性。一个加速器在执行不必要或冗余计算时,可能具有很高的占空比。因此,我们需要一个更复杂的指标。
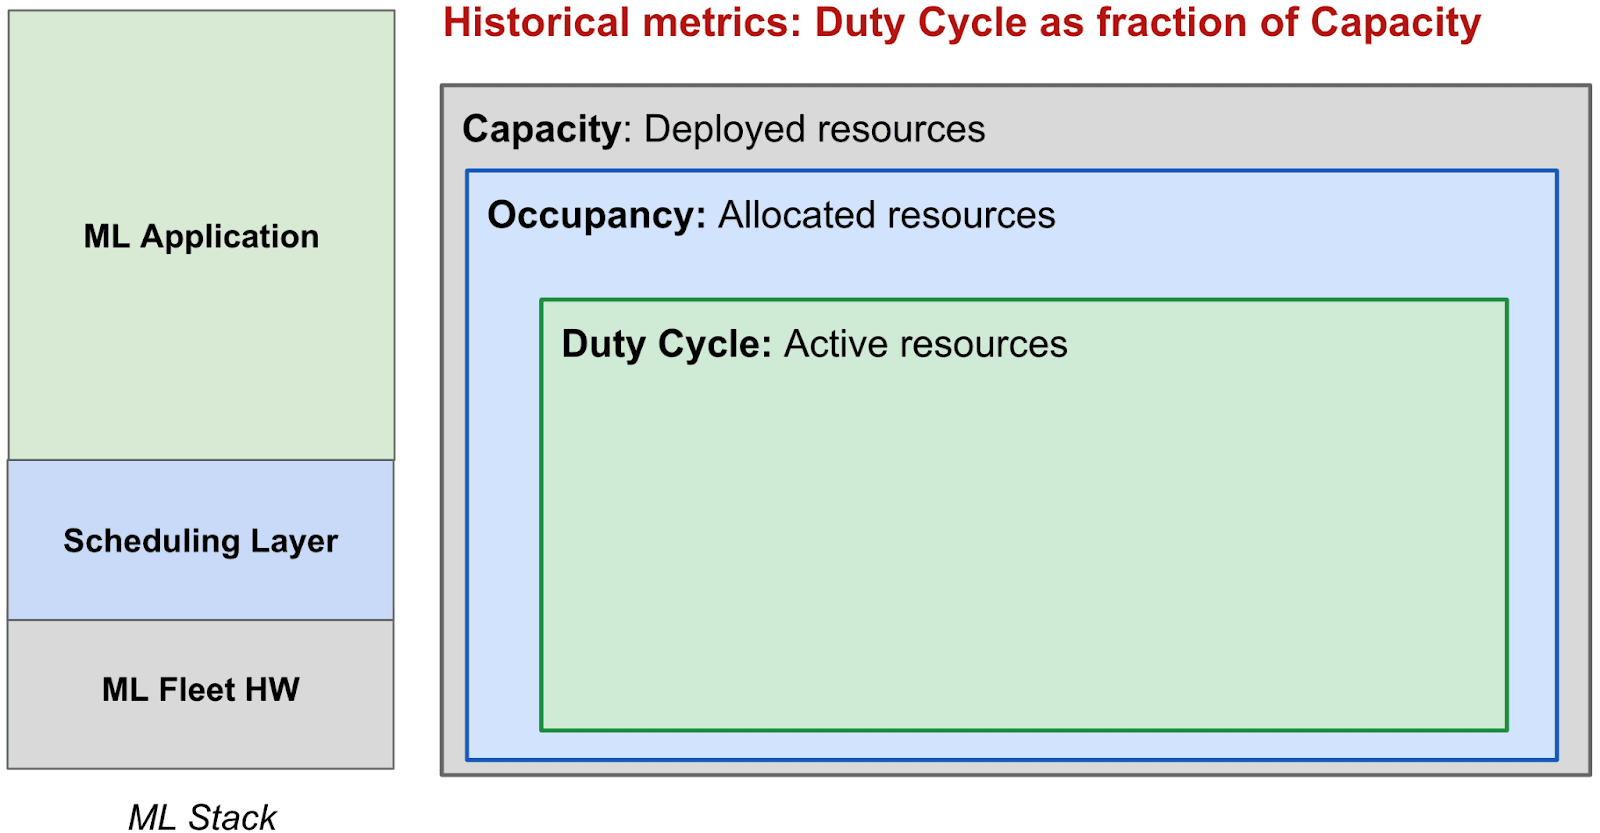
Figure 16.Traditional utilization-based metrics. We replace these using goodput as a measure of fleet efficiency rather than utilization. 图 16. 传统基于利用率的指标。我们用产出率代替利用率,作为衡量机群效率的指标。
Overarching Misconception: Utilization == Productivity. The thread among these metrics is the assumption that keeping accelerators busy equates to productive work. However, this overlooks critical factors. (1) Quality of Computations: None of these metrics assess whether the operations being performed are actually contributing to the desired output. (2) Workload Efficiency: They do not consider whether the workloads are optimally designed for the hardware. (3) System-level Bottlenecks: Focusing solely on accelerator usage ignores potential bottlenecks in data loading, memory access, or inter-accelerator communication. (4) Forward Progress: The traditional metrics provide no insight into how much useful work is being accomplished towards completing an actual ML task, thus motivating the need for a goodput-based metric, MPG. 普遍误解:利用率等于生产力。这些指标之间的联系在于假设让加速器保持忙碌等同于有成效的工作。然而,这忽略了关键因素。(1) 计算质量:这些指标均未评估所执行的操作是否真正有助于实现预期输出。(2) 工作负载效率:它们不考虑工作负载是否为硬件进行了优化设计。(3) 系统级瓶颈:仅关注加速器使用情况会忽略数据加载、内存访问或加速器间通信中的潜在瓶颈。(4) 前进进度:传统指标无法提供关于完成实际机器学习任务所取得的实际有用工作量的洞察,因此促使我们需要基于有效产出的指标,即 MPG。
Our study presents an analysis of ML fleet efficiency using Google’s TPU-based fleet. In Section 2 and Section 3, we provide an anatomy of the ML system stack and highlight the unique challenges of performance optimization for ML fleets. These challenges include rapid model and hardware evolution and orchestration of hardware/software co-design. To address these issues, we introduce the ML Productivity Goodput (MPG) metric in Section 4. The MPG metric decomposes ML fleet efficiency into three key components: Scheduling, Runtime, and Program Goodputs. 我们的研究使用 Google 的基于 TPU 的集群分析了机器学习集群效率。在第 2 节和第 3 节中,我们提供了机器学习系统堆栈的解剖结构,并突出了机器学习集群性能优化的独特挑战。这些挑战包括快速模型和硬件的演进以及软硬件协同设计的编排。为了解决这些问题,我们在第 4 节介绍了机器学习生产力吞吐量(MPG)指标。MPG 指标将机器学习集群效率分解为三个关键组成部分:调度、运行时和程序吞吐量。
The composable nature of the MPG metric allows us to dissect efficiency trends over time and precisely identify performance bottlenecks at specific layers of the stack. Our work demonstrates that this modular approach helps us develop and deploy more targeted optimization efforts and quantify their impact in an interpretable way. In Section 5, we provide examples of real efficiency improvements from leveraging MPG with Google’s own TPU fleet. The results demonstrate that the methodology presented in this paper can be generally applied to large-scale ML fleets across industry. MPG 指标的可组合特性使我们能够分析随时间变化的效率趋势,并精确识别堆栈特定层级的性能瓶颈。我们的研究表明,这种模块化方法帮助我们开发并部署更具针对性的优化工作,并以可解释的方式量化其影响。在第 5 节中,我们提供了利用 MPG 与 Google 自身 TPU 集群实现真实效率提升的示例。结果表明,本文提出的方法可以普遍应用于各行业的超大规模机器学习集群。
Our work is a product of the collaboration of many teams at Google, including the XLA team, the ML Metrics team, and the TPU Performance team. We are grateful to Daniel Herrington, Victor Cai, Kongtao Chen, Yiru Sun, Yinquan Hao, Aleksey Orekhov, Peter Ma, and Jie Sun for their support with metrics instrumentation and Amit Sabne and Shibo Wang for support with XLA optimizations. We also thank Sushma Prasad, Martin Maas, Dan Zhang, David Patterson, Michael Burrows, Charles Chang, Peter Mattson, and Michael Isard for their valuable review and feedback on this publication. 我们的工作得益于谷歌多个团队的协作,包括 XLA 团队、ML Metrics 团队和 TPU Performance 团队。我们感谢 Daniel Herrington、Victor Cai、Kongtao Chen、Yiru Sun、Yinquan Hao、Aleksey Orekhov、Peter Ma 和 Jie Sun 在指标仪器方面的支持,以及 Amit Sabne 和 Shibo Wang 在 XLA 优化方面的支持。我们还感谢 Sushma Prasad、Martin Maas、Dan Zhang、David Patterson、Michael Burrows、Charles Chang、Peter Mattson 和 Michael Isard 对本次发表的宝贵审阅和反馈。
在个人 / 团队系统中,“fleet”可以是:
关键不是规模,而是:
是否存在 资源调度 + 运行时管理 + 程序执行 的分层结构。
下面是工程上可实现的定义(不需要 TPU / XLA)。
可以这样定义:
SG = 作业真正“具备所有必需资源并可同步推进”的时间 ÷ 理论可用资源时间
在常见系统中的实现方式:
单机多卡
多机训练
K8s
要记录的信号
如果 SG 低,别急着优化模型,这是调度问题。
工程版定义:
RG = 被 checkpoint / 日志确认“有效”的训练进度所消耗的时间 ÷ 实际分配到资源的时间(SG 分子)
在系统里,以下时间不应算 RG:
如何实现
记录:
RG 低,说明“系统在拖慢模型”。
实用定义:
PG ≈ 理论最优 step time ÷ 实际 step time
理论最优怎么估?
PG 揭示的问题
PG 低,才需要动模型和编译器。
| 现象 | 优先级 |
|---|---|
| SG 低 | 调度 / 资源管理 |
| SG 高、RG 低 | 数据管道 / runtime |
| SG 高、RG 高、PG 低 | 模型 / 并行 / 编译 |
| 三者都高 | 扩规模或降成本 |
这能避免 模型还没吃饱算力就开始调 kernel 的常见误区。
任何优化都应该回答三件事:
这比单纯看 wall-clock speedup 更稳健。
可以按以下方式分段:
平均值看不出的问题,分段后往往非常明显。